| Name: FAM168A | Sequence: fasta or formatted (235aa) | NCBI GI: 124358904 | |
|
Description: hypothetical protein LOC23201
| Not currently referenced in the text | ||
|
Composition:

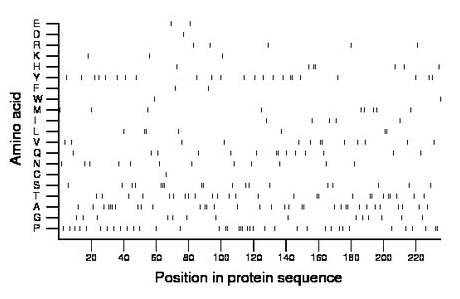
Amino acid Percentage Count Longest homopolymer A alanine 14.0 33 3 C cysteine 0.4 1 1 D aspartate 0.4 1 1 E glutamate 0.9 2 1 F phenylalanine 0.9 2 1 G glycine 6.0 14 1 H histidine 3.0 7 2 I isoleucine 2.1 5 1 K lysine 1.3 3 1 L leucine 3.0 7 2 M methionine 3.8 9 1 N asparagine 5.1 12 1 P proline 16.2 38 3 Q glutamine 6.0 14 2 R arginine 2.1 5 1 S serine 7.7 18 3 T threonine 11.1 26 2 V valine 5.5 13 2 W tryptophan 0.9 2 1 Y tyrosine 9.8 23 2 |
Comparative genomics:
Search single species RefSeq proteins at NCBI
Search summary 
Figure data | ||
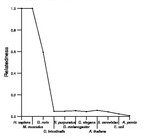
Related human proteins:Protein Relative score Description Self-match 1.000 hypothetical protein LOC23201 FAM168B 0.486 hypothetical protein LOC130074 MUC2 0.053 mucin 2 precursor MUC7 0.053 mucin 7, secreted precursor MUC7 0.053 mucin 7, secreted precursor MUC7 0.053 mucin 7, secreted precursor MUC6 0.042 mucin 6, gastric POLR2A 0.040 DNA-directed RNA polymerase II A CCNK 0.038 cyclin K isoform 1 R3HDM1 0.036 R3H domain containing 1 KRTAP4-6 0.032 PREDICTED: keratin associated protein 4.6 ZNF207 0.032 zinc finger protein 207 isoform b LOC100134147 0.032 PREDICTED: hypothetical protein SRCAP 0.029 Snf2-related CBP activator protein EWSR1 0.029 Ewing sarcoma breakpoint region 1 isoform 4 SFPQ 0.029 splicing factor proline/glutamine rich (polypyrimidin... PER1 0.027 period 1 LDB3 0.027 LIM domain binding 3 isoform 2 LDB3 0.027 LIM domain binding 3 isoform 1 EWSR1 0.027 Ewing sarcoma breakpoint region 1 isoform 5 EWSR1 0.027 Ewing sarcoma breakpoint region 1 isoform 3 EWSR1 0.027 Ewing sarcoma breakpoint region 1 isoform 1 EWSR1 0.027 Ewing sarcoma breakpoint region 1 isoform 2 MAZ 0.027 MYC-associated zinc finger protein isoform 2 MAZ 0.027 MYC-associated zinc finger protein isoform 1 ZNF469 0.027 zinc finger protein 469 MUC17 0.027 mucin 17 MUC5AC 0.025 mucin 5AC SYVN1 0.025 synoviolin 1 isoform b LOC100128719 0.025 PREDICTED: hypothetical protein, partialHuman BLASTP results (used to prepare the table) | |||
Gene descriptions are from NCBI RefSeq. Search results were obtained with NCBI BLAST and RefSeq entries. When identical proteins are present, the self-match may not be listed first in BLASTP output. In such cases, the table above has been reordered to place it first.
See About the Figures for the scoring system used in the figure above right. The same scoring system was used in the table of BLASTP results.
Guide to the Human Genome
Copyright © 2010 by Stewart Scherer. All rights reserved.
