
| Name: PLSCR3 | Sequence: fasta or formatted (295aa) | NCBI GI: 31543417 | |
|
Description: phospholipid scramblase 3
|
Referenced in: Mitochondria
| ||
|
Composition:
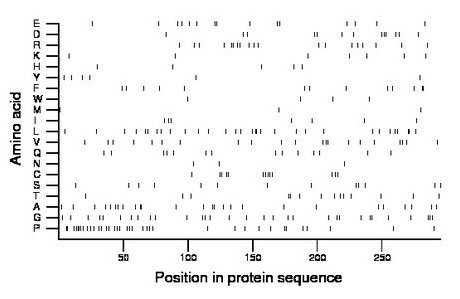
Amino acid Percentage Count Longest homopolymer A alanine 8.8 26 2 C cysteine 4.4 13 2 D aspartate 4.4 13 2 E glutamate 5.1 15 2 F phenylalanine 4.4 13 2 G glycine 10.5 31 2 H histidine 1.7 5 1 I isoleucine 2.4 7 1 K lysine 2.4 7 1 L leucine 10.5 31 2 M methionine 1.0 3 1 N asparagine 1.0 3 1 P proline 12.5 37 4 Q glutamine 4.7 14 1 R arginine 6.4 19 2 S serine 4.4 13 1 T threonine 4.7 14 2 V valine 7.1 21 2 W tryptophan 1.4 4 1 Y tyrosine 2.0 6 1 |
Comparative genomics:
Search single species RefSeq proteins at NCBI
Search summary 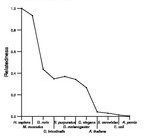
Figure data | ||
Related human proteins:Protein Relative score Description Self-match 1.000 phospholipid scramblase 3 PLSCR1 0.444 phospholipid scramblase 1 PLSCR2 0.386 phospholipid scramblase 2 PLSCR5 0.368 phospholipid scramblase family, member 5 PLSCR4 0.293 phospholipid scramblase 4 isoform a PLSCR4 0.293 phospholipid scramblase 4 isoform a PLSCR4 0.293 phospholipid scramblase 4 isoform a PLSCR4 0.173 phospholipid scramblase 4 isoform b LOC440981 0.092 PREDICTED: similar to hCG1794790 LOC440981 0.092 PREDICTED: similar to hCG1794790 LOC440981 0.088 PREDICTED: similar to hCG1794790 SETD1B 0.045 SET domain containing 1B DIAPH1 0.038 diaphanous 1 isoform 2 DIAPH1 0.038 diaphanous 1 isoform 1 TBC1D10B 0.038 TBC1 domain family, member 10B RBM27 0.038 RNA binding motif protein 27 LDB3 0.037 LIM domain binding 3 isoform 2 LDB3 0.037 LIM domain binding 3 isoform 1 PTPN23 0.037 protein tyrosine phosphatase, non-receptor type 23 [... CDKN1C 0.035 cyclin-dependent kinase inhibitor 1C isoform b [Hom... CDKN1C 0.035 cyclin-dependent kinase inhibitor 1C isoform b [Hom... CDKN1C 0.035 cyclin-dependent kinase inhibitor 1C isoform a ZFPM1 0.035 zinc finger protein, multitype 1 TPRX1 0.033 tetra-peptide repeat homeobox CPSF6 0.033 cleavage and polyadenylation specific factor 6, 68 ... ESX1 0.033 extraembryonic, spermatogenesis, homeobox 1-like [Ho... WASL 0.033 Wiskott-Aldrich syndrome gene-like protein ANXA11 0.032 annexin A11 ANXA11 0.032 annexin A11 ANXA11 0.032 annexin A11Human BLASTP results (used to prepare the table) | |||
Gene descriptions are from NCBI RefSeq. Search results were obtained with NCBI BLAST and RefSeq entries. When identical proteins are present, the self-match may not be listed first in BLASTP output. In such cases, the table above has been reordered to place it first.
See About the Figures for the scoring system used in the figure above right. The same scoring system was used in the table of BLASTP results.
Guide to the Human Genome
Copyright © 2010 by Stewart Scherer. All rights reserved.
