
| Name: MIA3 | Sequence: fasta or formatted (1907aa) | NCBI GI: 122891870 | |
|
Description: melanoma inhibitory activity family, member 3
|
Referenced in:
| ||
|
Composition:
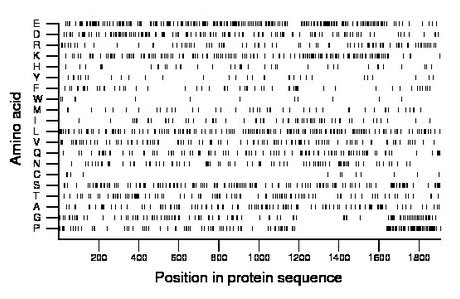
Amino acid Percentage Count Longest homopolymer A alanine 6.1 116 3 C cysteine 0.6 12 1 D aspartate 7.1 135 4 E glutamate 12.0 229 3 F phenylalanine 2.9 56 2 G glycine 5.6 107 2 H histidine 2.1 41 2 I isoleucine 3.1 60 2 K lysine 7.8 148 4 L leucine 8.8 167 2 M methionine 2.4 46 2 N asparagine 4.6 87 2 P proline 7.0 133 4 Q glutamine 5.3 101 2 R arginine 4.2 80 2 S serine 7.7 146 4 T threonine 5.2 99 2 V valine 5.2 99 2 W tryptophan 0.6 12 1 Y tyrosine 1.7 33 2 |
Comparative genomics:
Search single species RefSeq proteins at NCBI
Search summary 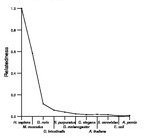
Figure data | ||
Related human proteins:Protein Relative score Description Self-match 1.000 melanoma inhibitory activity family, member 3 [Homo... CTAGE5 0.068 CTAGE family, member 5 isoform 3 CTAGE5 0.066 CTAGE family, member 5 isoform 1 CTAGE5 0.066 CTAGE family, member 5 isoform 2 CTAGE5 0.063 CTAGE family, member 5 isoform 4 CTAGE6 0.057 CTAGE family, member 6 LOC441294 0.057 hypothetical protein LOC441294 CTAGE4 0.056 CTAGE family, member 4 LOC643854 0.056 hypothetical protein LOC643854 CTAGE1 0.053 cutaneous T-cell lymphoma-associated antigen 1 isofo... SPZ1 0.031 spermatogenic leucine zipper 1 MIA2 0.023 melanoma inhibitory activity 2 MYH13 0.018 myosin, heavy polypeptide 13, skeletal muscle [Homo... DIAPH1 0.017 diaphanous 1 isoform 2 DIAPH1 0.017 diaphanous 1 isoform 1 MYH3 0.017 myosin, heavy chain 3, skeletal muscle, embryonic [H... MYH8 0.017 myosin, heavy chain 8, skeletal muscle, perinatal [... OTOR 0.017 otoraplin precursor MYH7 0.017 myosin, heavy chain 7, cardiac muscle, beta MYH10 0.016 myosin, heavy polypeptide 10, non-muscle CENPF 0.016 centromere protein F MYH4 0.016 myosin, heavy polypeptide 4, skeletal muscle MYH11 0.016 smooth muscle myosin heavy chain 11 isoform SM1A [Ho... MYH11 0.016 smooth muscle myosin heavy chain 11 isoform SM1B [Ho... MYH11 0.016 smooth muscle myosin heavy chain 11 isoform SM2B [Ho... MYH11 0.016 smooth muscle myosin heavy chain 11 isoform SM2A [Ho... HOOK3 0.016 golgi-associated microtubule-binding protein HOOK3 [... CCDC88C 0.016 DVL-binding protein DAPLE MYH15 0.016 myosin, heavy polypeptide 15 LOC727832 0.015 golgi autoantigen, golgin subfamily a-likeHuman BLASTP results (used to prepare the table) | |||
Gene descriptions are from NCBI RefSeq. Search results were obtained with NCBI BLAST and RefSeq entries. When identical proteins are present, the self-match may not be listed first in BLASTP output. In such cases, the table above has been reordered to place it first.
See About the Figures for the scoring system used in the figure above right. The same scoring system was used in the table of BLASTP results.
Guide to the Human Genome
Copyright © 2010 by Stewart Scherer. All rights reserved.
