
| Name: CTAGE5 | Sequence: fasta or formatted (761aa) | NCBI GI: 42740899 | |
|
Description: CTAGE family, member 5 isoform 3
|
Referenced in:
| ||
Other entries for this name:
alt prot [804aa] CTAGE family, member 5 isoform 1 alt prot [775aa] CTAGE family, member 5 isoform 4 alt prot [792aa] CTAGE family, member 5 isoform 2 | |||
|
Composition:
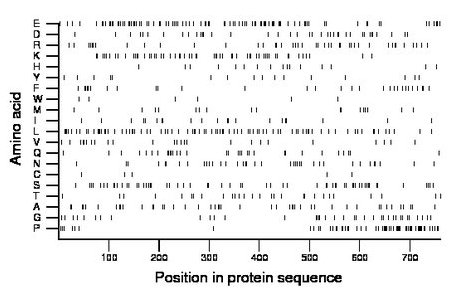
Amino acid Percentage Count Longest homopolymer A alanine 6.0 46 2 C cysteine 0.7 5 1 D aspartate 5.1 39 3 E glutamate 12.4 94 3 F phenylalanine 3.8 29 2 G glycine 4.9 37 1 H histidine 2.1 16 1 I isoleucine 2.8 21 2 K lysine 7.4 56 2 L leucine 11.0 84 3 M methionine 2.5 19 2 N asparagine 4.9 37 1 P proline 8.7 66 5 Q glutamine 4.5 34 2 R arginine 5.7 43 2 S serine 7.8 59 2 T threonine 3.7 28 1 V valine 3.4 26 2 W tryptophan 0.8 6 1 Y tyrosine 2.1 16 1 |
Comparative genomics:
Search single species RefSeq proteins at NCBI
Search summary 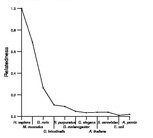
Figure data | ||
Related human proteins:Protein Relative score Description Self-match 1.000 CTAGE family, member 5 isoform 3 CTAGE5 0.986 CTAGE family, member 5 isoform 1 CTAGE5 0.958 CTAGE family, member 5 isoform 2 CTAGE5 0.948 CTAGE family, member 5 isoform 4 LOC441294 0.787 hypothetical protein LOC441294 CTAGE6 0.784 CTAGE family, member 6 LOC643854 0.780 hypothetical protein LOC643854 CTAGE4 0.778 CTAGE family, member 4 CTAGE1 0.778 cutaneous T-cell lymphoma-associated antigen 1 isofo... MIA3 0.170 melanoma inhibitory activity family, member 3 [Homo... KTN1 0.048 kinectin 1 isoform a KTN1 0.048 kinectin 1 isoform c KTN1 0.048 kinectin 1 isoform a CCDC88A 0.040 coiled-coil domain containing 88A isoform 2 CCDC88A 0.040 coiled-coil domain containing 88A isoform 1 MYH6 0.040 myosin heavy chain 6 MYH10 0.038 myosin, heavy polypeptide 10, non-muscle LOC645202 0.037 PREDICTED: hypothetical protein LOC645202 CENPF 0.037 centromere protein F SYCP1 0.036 synaptonemal complex protein 1 MYH1 0.036 myosin, heavy chain 1, skeletal muscle, adult [Homo... MYH2 0.036 myosin, heavy chain 2, skeletal muscle, adult [Homo... MYH2 0.036 myosin, heavy chain 2, skeletal muscle, adult [Homo... MYH9 0.036 myosin, heavy polypeptide 9, non-muscle CIT 0.036 citron TCHH 0.036 trichohyalin MYO18A 0.036 myosin 18A isoform b MYO18A 0.036 myosin 18A isoform a EEA1 0.035 early endosome antigen 1, 162kD MYH4 0.035 myosin, heavy polypeptide 4, skeletal muscleHuman BLASTP results (used to prepare the table) | |||
Gene descriptions are from NCBI RefSeq. Search results were obtained with NCBI BLAST and RefSeq entries. When identical proteins are present, the self-match may not be listed first in BLASTP output. In such cases, the table above has been reordered to place it first.
See About the Figures for the scoring system used in the figure above right. The same scoring system was used in the table of BLASTP results.
Guide to the Human Genome
Copyright © 2010 by Stewart Scherer. All rights reserved.
