
| Name: IRF9 | Sequence: fasta or formatted (393aa) | NCBI GI: 25282407 | |
|
Description: interferon-stimulated transcription factor 3, gamma 48kDa
|
Referenced in:
| ||
|
Composition:
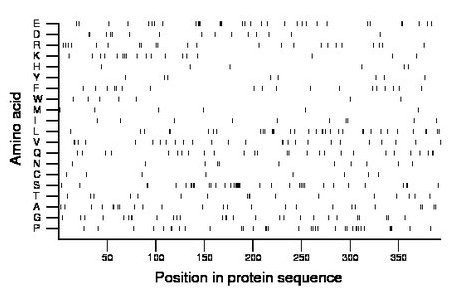
Amino acid Percentage Count Longest homopolymer A alanine 6.4 25 2 C cysteine 2.0 8 1 D aspartate 3.8 15 2 E glutamate 8.4 33 3 F phenylalanine 4.6 18 2 G glycine 7.1 28 2 H histidine 1.5 6 1 I isoleucine 2.5 10 1 K lysine 4.6 18 1 L leucine 8.9 35 3 M methionine 1.5 6 1 N asparagine 2.8 11 2 P proline 8.9 35 3 Q glutamine 6.9 27 2 R arginine 5.9 23 1 S serine 9.4 37 7 T threonine 4.3 17 2 V valine 6.6 26 2 W tryptophan 1.8 7 1 Y tyrosine 2.0 8 1 |
Comparative genomics:
Search single species RefSeq proteins at NCBI
Search summary 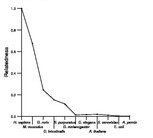
Figure data | ||
Related human proteins:Protein Relative score Description Self-match 1.000 interferon-stimulated transcription factor 3, gamma ... IRF8 0.245 interferon regulatory factor 8 IRF4 0.233 interferon regulatory factor 4 IRF6 0.177 interferon regulatory factor 6 IRF5 0.156 interferon regulatory factor 5 isoform c IRF5 0.156 interferon regulatory factor 5 isoform c IRF5 0.156 interferon regulatory factor 5 isoform c IRF5 0.152 interferon regulatory factor 5 isoform b IRF5 0.152 interferon regulatory factor 5 isoform b IRF5 0.152 interferon regulatory factor 5 isoform a IRF5 0.147 interferon regulatory factor 5 isoform d IRF7 0.105 interferon regulatory factor 7 isoform d IRF7 0.105 interferon regulatory factor 7 isoform a IRF7 0.105 interferon regulatory factor 7 isoform b IRF3 0.099 interferon regulatory factor 3 IRF1 0.096 interferon regulatory factor 1 IRF2 0.092 interferon regulatory factor 2 LOC100293297 0.047 PREDICTED: similar to hCG1785205 LOC100288352 0.047 PREDICTED: similar to hCG1785205 LOC100288352 0.047 PREDICTED: hypothetical protein XP_002343764 EGR1 0.014 early growth response 1 AEBP2 0.014 AE binding protein 2 isoform b AEBP2 0.014 AE binding protein 2 isoform a SETD1A 0.012 SET domain containing 1A ZBTB4 0.012 zinc finger and BTB domain containing 4 ZBTB4 0.012 zinc finger and BTB domain containing 4 RERE 0.012 atrophin-1 like protein isoform b RERE 0.012 atrophin-1 like protein isoform a RERE 0.012 atrophin-1 like protein isoform a REST 0.012 RE1-silencing transcription factorHuman BLASTP results (used to prepare the table) | |||
Gene descriptions are from NCBI RefSeq. Search results were obtained with NCBI BLAST and RefSeq entries. When identical proteins are present, the self-match may not be listed first in BLASTP output. In such cases, the table above has been reordered to place it first.
See About the Figures for the scoring system used in the figure above right. The same scoring system was used in the table of BLASTP results.
Guide to the Human Genome
Copyright © 2010 by Stewart Scherer. All rights reserved.
