
| Name: LOC100292680 | Sequence: fasta or formatted (436aa) | NCBI GI: 239755719 | |
|
Description: PREDICTED: similar to hCG2003440
| Not currently referenced in the text | ||
|
Composition:
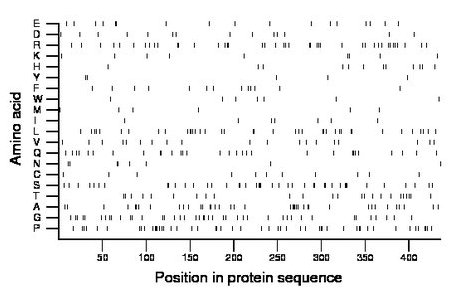
Amino acid Percentage Count Longest homopolymer A alanine 8.9 39 3 C cysteine 2.5 11 1 D aspartate 3.2 14 1 E glutamate 3.9 17 2 F phenylalanine 3.0 13 1 G glycine 9.6 42 2 H histidine 2.8 12 1 I isoleucine 1.6 7 1 K lysine 2.1 9 1 L leucine 8.9 39 2 M methionine 1.4 6 1 N asparagine 1.8 8 2 P proline 11.5 50 3 Q glutamine 6.9 30 2 R arginine 9.6 42 2 S serine 9.6 42 3 T threonine 5.5 24 1 V valine 4.4 19 1 W tryptophan 1.6 7 1 Y tyrosine 1.1 5 1 |
Comparative genomics:
Search single species RefSeq proteins at NCBI
Search summary 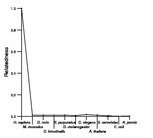
Figure data | ||
Related human proteins:Protein Relative score Description Self-match 1.000 PREDICTED: similar to hCG2003440 GLTSCR1 0.016 glioma tumor suppressor candidate region gene 1 [Ho... MYO1F 0.016 myosin IF LOC100133142 0.014 PREDICTED: similar to zinc finger protein 208 [Homo... LOC100133142 0.014 PREDICTED: similar to zinc finger protein 208 [Homo... LOC728503 0.012 PREDICTED: hypothetical protein LOC728503 0.012 PREDICTED: hypothetical protein LOC728503 0.012 PREDICTED: hypothetical protein LOC728317 0.012 PREDICTED: hypothetical protein LOC728317 0.012 PREDICTED: hypothetical protein LOC728317 0.012 PREDICTED: hypothetical protein LOC728307 0.012 PREDICTED: hypothetical protein MRAP 0.011 melanocortin 2 receptor accessory protein isoform al... LOC729570 0.011 PREDICTED: hypothetical protein LOC729570 0.011 PREDICTED: hypothetical protein LOC729570 0.011 PREDICTED: hypothetical protein DMWD 0.011 dystrophia myotonica-containing WD repeat motif prot... FLJ22184 0.010 PREDICTED: hypothetical protein FLJ22184 KCTD12 0.010 potassium channel tetramerisation domain containing ... XIRP1 0.010 xin actin-binding repeat containing 1 LOC100292453 0.009 PREDICTED: hypothetical protein LOC100288612 0.009 PREDICTED: hypothetical protein FMN2 0.009 formin 2 FAM48B1 0.009 hypothetical protein LOC100130302 FOXB2 0.009 forkhead box B2 IGSF9B 0.009 immunoglobulin superfamily, member 9B LOC100292150 0.009 PREDICTED: hypothetical protein LOC100291220 0.009 PREDICTED: hypothetical protein XP_002347633 LOC100133655 0.009 PREDICTED: hypothetical protein LOC100290302 0.009 PREDICTED: hypothetical protein XP_002346480Human BLASTP results (used to prepare the table) | |||
Gene descriptions are from NCBI RefSeq. Search results were obtained with NCBI BLAST and RefSeq entries. When identical proteins are present, the self-match may not be listed first in BLASTP output. In such cases, the table above has been reordered to place it first.
See About the Figures for the scoring system used in the figure above right. The same scoring system was used in the table of BLASTP results.
Guide to the Human Genome
Copyright © 2010 by Stewart Scherer. All rights reserved.
