
| Name: LOC100292727 | Sequence: fasta or formatted (402aa) | NCBI GI: 239755710 | |
|
Description: PREDICTED: hypothetical protein
| Not currently referenced in the text | ||
|
Composition:
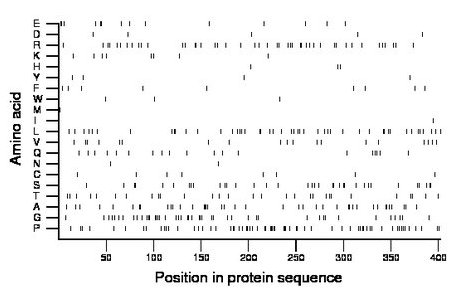
Amino acid Percentage Count Longest homopolymer A alanine 10.0 40 3 C cysteine 2.0 8 1 D aspartate 1.2 5 1 E glutamate 3.5 14 2 F phenylalanine 2.2 9 1 G glycine 11.2 45 3 H histidine 0.7 3 1 I isoleucine 0.2 1 1 K lysine 2.0 8 1 L leucine 11.7 47 2 M methionine 0.2 1 1 N asparagine 0.5 2 1 P proline 16.2 65 3 Q glutamine 4.7 19 1 R arginine 11.2 45 2 S serine 8.7 35 2 T threonine 7.2 29 1 V valine 4.7 19 1 W tryptophan 0.7 3 1 Y tyrosine 1.0 4 1 |
Comparative genomics:
Search single species RefSeq proteins at NCBI
Search summary 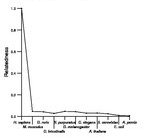
Figure data | ||
Related human proteins:Protein Relative score Description Self-match 1.000 PREDICTED: hypothetical protein LOC100292184 0.604 PREDICTED: hypothetical protein LOC100287524 0.579 PREDICTED: hypothetical protein XP_002342307 LOC100287920 0.466 PREDICTED: hypothetical protein XP_002344198 TAF4 0.048 TBP-associated factor 4 SRRM2 0.045 splicing coactivator subunit SRm300 RERE 0.044 atrophin-1 like protein isoform b RERE 0.044 atrophin-1 like protein isoform a RERE 0.044 atrophin-1 like protein isoform a FLJ22184 0.041 PREDICTED: hypothetical protein LOC80164 LMTK3 0.041 lemur tyrosine kinase 3 FLJ22184 0.040 PREDICTED: hypothetical protein FLJ22184 NACA 0.039 nascent polypeptide-associated complex alpha subuni... SRRM1 0.039 serine/arginine repetitive matrix 1 MYO15A 0.039 myosin XV MBD6 0.039 methyl-CpG binding domain protein 6 FLJ22184 0.038 PREDICTED: hypothetical protein FLJ22184 LOC389813 0.038 similar to CG15216-PA WIPF1 0.036 WAS/WASL interacting protein family, member 1 [Homo... WIPF1 0.036 WAS/WASL interacting protein family, member 1 DACT3 0.036 thymus expressed gene 3-like CASKIN1 0.036 CASK interacting protein 1 GLTSCR1 0.035 glioma tumor suppressor candidate region gene 1 [Ho... MYPOP 0.035 Myb protein P42POP PCLO 0.035 piccolo isoform 2 PCLO 0.035 piccolo isoform 1 MLL4 0.034 myeloid/lymphoid or mixed-lineage leukemia 4 C11orf9 0.034 hypothetical protein LOC745 isoform 1 C11orf9 0.034 hypothetical protein LOC745 isoform 2 COL3A1 0.034 collagen type III alpha 1 preproproteinHuman BLASTP results (used to prepare the table) | |||
Gene descriptions are from NCBI RefSeq. Search results were obtained with NCBI BLAST and RefSeq entries. When identical proteins are present, the self-match may not be listed first in BLASTP output. In such cases, the table above has been reordered to place it first.
See About the Figures for the scoring system used in the figure above right. The same scoring system was used in the table of BLASTP results.
Guide to the Human Genome
Copyright © 2010 by Stewart Scherer. All rights reserved.
