
| Name: LOC100294457 | Sequence: fasta or formatted (141aa) | NCBI GI: 239747192 | |
|
Description: PREDICTED: similar to hCG2038988
| Not currently referenced in the text | ||
|
Composition:
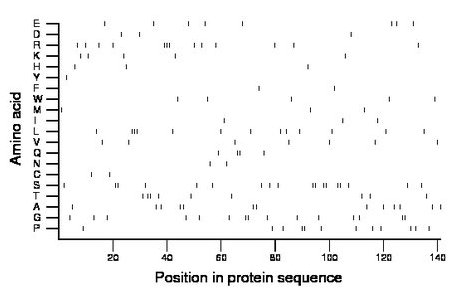
Amino acid Percentage Count Longest homopolymer A alanine 9.2 13 2 C cysteine 1.4 2 1 D aspartate 2.1 3 1 E glutamate 5.7 8 1 F phenylalanine 1.4 2 1 G glycine 10.6 15 2 H histidine 2.1 3 1 I isoleucine 2.1 3 1 K lysine 3.5 5 1 L leucine 9.2 13 3 M methionine 2.1 3 1 N asparagine 1.4 2 1 P proline 8.5 12 2 Q glutamine 2.8 4 2 R arginine 9.2 13 3 S serine 12.8 18 2 T threonine 6.4 9 2 V valine 5.0 7 1 W tryptophan 3.5 5 1 Y tyrosine 0.7 1 1 |
Comparative genomics:
Search single species RefSeq proteins at NCBI
Search summary 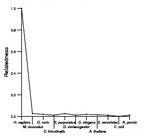
Figure data | ||
Related human proteins:Protein Relative score Description Self-match 1.000 PREDICTED: similar to hCG2038988 LOC100293561 0.079 PREDICTED: similar to Protein MOST-1 C8orf44 0.071 hypothetical protein LOC56260 TCTN1 0.049 tectonic family member 1 isoform 3 ZNF91 0.030 zinc finger protein 91 CYB561D1 0.030 cytochrome b-561 domain containing 1 isoform 5 [Hom... CYB561D1 0.030 cytochrome b-561 domain containing 1 isoform 4 [Hom... CYB561D1 0.030 cytochrome b-561 domain containing 1 isoform 1 [Hom... LOC360030 0.026 homeobox C14 HIC2 0.026 hypermethylated in cancer 2 LOC391359 0.023 PREDICTED: similar to hCG1784039 NCOR2 0.019 nuclear receptor co-repressor 2 isoform 2 MUC20 0.015 mucin 20 isoform S MUC20 0.015 mucin 20 isoform L LOC100294407 0.015 PREDICTED: similar to hCG2039376 NCOR2 0.015 nuclear receptor co-repressor 2 isoform 1 SRRM2 0.015 splicing coactivator subunit SRm300 LOC643355 0.011 PREDICTED: hypothetical protein LOC643355 0.011 PREDICTED: hypothetical protein LOC643355 0.011 PREDICTED: hypothetical protein CASKIN2 0.011 cask-interacting protein 2 isoform b CASKIN2 0.011 cask-interacting protein 2 isoform a C22orf29 0.011 hypothetical protein LOC79680 FOXI1 0.011 forkhead box I1 isoform b TOX3 0.008 TOX high mobility group box family member 3 isoform... TOX3 0.008 TOX high mobility group box family member 3 isoform... NOTCH3 0.008 Notch homolog 3 TSC1 0.008 tuberous sclerosis 1 protein isoform 1 TSC1 0.008 tuberous sclerosis 1 protein isoform 4 TSC1 0.008 tuberous sclerosis 1 protein isoform 3Human BLASTP results (used to prepare the table) | |||
Gene descriptions are from NCBI RefSeq. Search results were obtained with NCBI BLAST and RefSeq entries. When identical proteins are present, the self-match may not be listed first in BLASTP output. In such cases, the table above has been reordered to place it first.
See About the Figures for the scoring system used in the figure above right. The same scoring system was used in the table of BLASTP results.
Guide to the Human Genome
Copyright © 2010 by Stewart Scherer. All rights reserved.
