
| Name: TSC1 | Sequence: fasta or formatted (1163aa) | NCBI GI: 241666462 | |
|
Description: tuberous sclerosis 1 protein isoform 3
|
Referenced in:
| ||
Other entries for this name:
alt prot [1113aa] tuberous sclerosis 1 protein isoform 4 alt prot [1164aa] tuberous sclerosis 1 protein isoform 1 | |||
|
Composition:
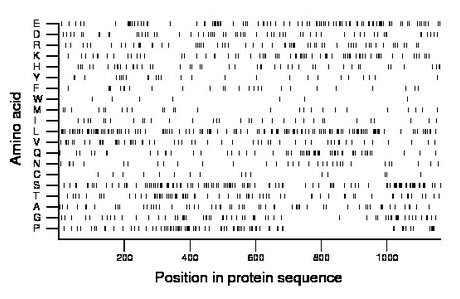
Amino acid Percentage Count Longest homopolymer A alanine 5.7 66 3 C cysteine 1.5 17 2 D aspartate 5.2 61 2 E glutamate 8.3 96 3 F phenylalanine 2.2 26 2 G glycine 5.5 64 4 H histidine 4.1 48 2 I isoleucine 2.8 33 1 K lysine 6.1 71 2 L leucine 12.0 139 4 M methionine 2.5 29 2 N asparagine 2.8 33 2 P proline 7.1 83 3 Q glutamine 5.2 61 3 R arginine 5.2 60 2 S serine 10.0 116 6 T threonine 6.0 70 2 V valine 4.9 57 3 W tryptophan 0.6 7 1 Y tyrosine 2.2 26 2 |
Comparative genomics:
Search single species RefSeq proteins at NCBI
Search summary 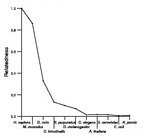
Figure data | ||
Related human proteins:Protein Relative score Description Self-match 1.000 tuberous sclerosis 1 protein isoform 3 TSC1 0.998 tuberous sclerosis 1 protein isoform 1 TSC1 0.945 tuberous sclerosis 1 protein isoform 4 EEA1 0.021 early endosome antigen 1, 162kD CGN 0.019 cingulin SMC1A 0.019 structural maintenance of chromosomes 1A GRIPAP1 0.017 GRIP1 associated protein 1 isoform 1 FAM184B 0.016 hypothetical protein LOC27146 LOC727832 0.016 golgi autoantigen, golgin subfamily a-like CLIP1 0.016 restin isoform b CLIP1 0.016 restin isoform a MYH10 0.016 myosin, heavy polypeptide 10, non-muscle INCENP 0.016 inner centromere protein antigens 135/155kDa isofor... GRIPAP1 0.016 GRIP1 associated protein 1 isoform 2 INCENP 0.015 inner centromere protein antigens 135/155kDa isofor... GOLGA6D 0.015 golgi autoantigen, golgin subfamily a, 6D GOLGA6C 0.015 PREDICTED: golgi autoantigen, golgin subfamily a, 6C... LOC645202 0.015 PREDICTED: hypothetical protein LOC645202 LOC283767 0.015 golgi autoantigen, golgin subfamily a-like LOC440243 0.015 PREDICTED: Putative golgin subfamily A member 6-lik... PLEC1 0.015 plectin 1 isoform 11 PLEC1 0.015 plectin 1 isoform 10 PLEC1 0.015 plectin 1 isoform 8 PLEC1 0.015 plectin 1 isoform 7 PLEC1 0.015 plectin 1 isoform 6 PLEC1 0.015 plectin 1 isoform 3 PLEC1 0.015 plectin 1 isoform 2 PLEC1 0.015 plectin 1 isoform 1 LOC727909 0.014 PREDICTED: similar to Golgin subfamily A member 8-l... CCDC18 0.014 sarcoma antigen NY-SAR-41Human BLASTP results (used to prepare the table) | |||
Gene descriptions are from NCBI RefSeq. Search results were obtained with NCBI BLAST and RefSeq entries. When identical proteins are present, the self-match may not be listed first in BLASTP output. In such cases, the table above has been reordered to place it first.
See About the Figures for the scoring system used in the figure above right. The same scoring system was used in the table of BLASTP results.
Guide to the Human Genome
Copyright © 2010 by Stewart Scherer. All rights reserved.
