
| Name: SPEM1 | Sequence: fasta or formatted (309aa) | NCBI GI: 116268095 | |
|
Description: spermatid maturation 1
|
Referenced in:
| ||
|
Composition:
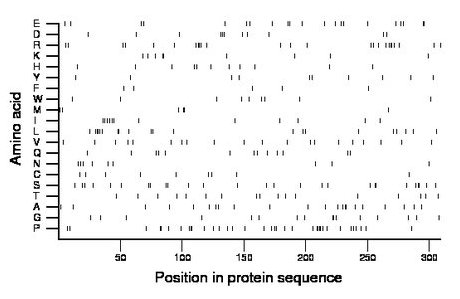
Amino acid Percentage Count Longest homopolymer A alanine 7.1 22 2 C cysteine 2.9 9 1 D aspartate 3.6 11 2 E glutamate 6.8 21 2 F phenylalanine 1.6 5 1 G glycine 5.2 16 2 H histidine 3.6 11 1 I isoleucine 3.9 12 2 K lysine 2.9 9 2 L leucine 6.8 21 4 M methionine 1.9 6 2 N asparagine 2.9 9 1 P proline 11.7 36 4 Q glutamine 4.2 13 1 R arginine 8.1 25 3 S serine 8.7 27 2 T threonine 5.5 17 1 V valine 6.5 20 1 W tryptophan 2.9 9 1 Y tyrosine 3.2 10 1 |
Comparative genomics:
Search single species RefSeq proteins at NCBI
Search summary 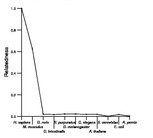
Figure data | ||
Related human proteins:Protein Relative score Description Self-match 1.000 spermatid maturation 1 C17orf74 0.050 hypothetical protein LOC201243 RTN4 0.024 reticulon 4 isoform B FSCB 0.024 fibrous sheath CABYR binding protein MTSS1 0.024 metastasis suppressor 1 LRFN2 0.019 leucine rich repeat and fibronectin type III domain ... RTN4 0.017 reticulon 4 isoform D RTN4 0.017 reticulon 4 isoform A PHC2 0.017 polyhomeotic-like 2 isoform a SETD1A 0.016 SET domain containing 1A TRIOBP 0.016 TRIO and F-actin binding protein isoform 6 HNRNPUL1 0.016 heterogeneous nuclear ribonucleoprotein U-like 1 iso... HNRNPUL1 0.016 heterogeneous nuclear ribonucleoprotein U-like 1 iso... DENND1A 0.016 DENN/MADD domain containing 1A isoform 1 LDB3 0.014 LIM domain binding 3 isoform 1 SYN2 0.014 synapsin II isoform IIa SYN2 0.014 synapsin II isoform IIb TIPIN 0.014 TIMELESS interacting protein BAT3 0.014 HLA-B associated transcript-3 isoform b BAT3 0.014 HLA-B associated transcript-3 isoform b BAT3 0.014 HLA-B associated transcript-3 isoform b BAT3 0.014 HLA-B associated transcript-3 isoform a GLTSCR1 0.014 glioma tumor suppressor candidate region gene 1 [Ho... C11orf84 0.014 hypothetical protein LOC144097 C4orf46 0.014 hypothetical protein LOC201725 C9orf131 0.014 hypothetical protein LOC138724 isoform D C9orf131 0.014 hypothetical protein LOC138724 isoform C C9orf131 0.014 hypothetical protein LOC138724 isoform B C9orf131 0.014 hypothetical protein LOC138724 isoform A FOXH1 0.013 forkhead box H1Human BLASTP results (used to prepare the table) | |||
Gene descriptions are from NCBI RefSeq. Search results were obtained with NCBI BLAST and RefSeq entries. When identical proteins are present, the self-match may not be listed first in BLASTP output. In such cases, the table above has been reordered to place it first.
See About the Figures for the scoring system used in the figure above right. The same scoring system was used in the table of BLASTP results.
Guide to the Human Genome
Copyright © 2010 by Stewart Scherer. All rights reserved.
