
| Name: SNX26 | Sequence: fasta or formatted (1126aa) | NCBI GI: 23510413 | |
|
Description: sorting nexin 26
|
Referenced in: Rho and Rac
| ||
|
Composition:
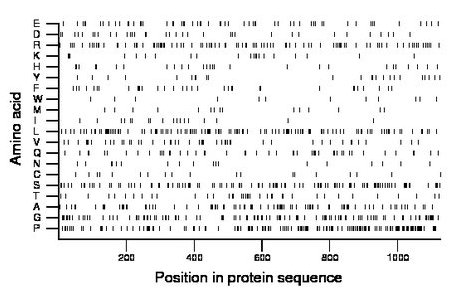
Amino acid Percentage Count Longest homopolymer A alanine 7.8 88 3 C cysteine 1.8 20 2 D aspartate 3.2 36 2 E glutamate 5.3 60 3 F phenylalanine 2.9 33 2 G glycine 9.9 111 4 H histidine 2.4 27 1 I isoleucine 1.6 18 1 K lysine 2.0 22 2 L leucine 11.2 126 3 M methionine 1.4 16 1 N asparagine 1.6 18 1 P proline 14.4 162 5 Q glutamine 4.4 49 2 R arginine 8.7 98 2 S serine 10.1 114 6 T threonine 3.5 39 2 V valine 4.6 52 3 W tryptophan 1.2 13 2 Y tyrosine 2.1 24 2 |
Comparative genomics:
Search single species RefSeq proteins at NCBI
Search summary 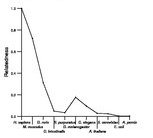
Figure data | ||
Related human proteins:Protein Relative score Description Self-match 1.000 sorting nexin 26 RICS 0.279 Rho GTPase-activating protein isoform 1 RICS 0.161 Rho GTPase-activating protein isoform 2 ARHGAP30 0.126 Rho GTPase activating protein 30 isoform 2 ARHGAP30 0.126 Rho GTPase activating protein 30 isoform 1 CDGAP 0.120 Cdc42 GTPase-activating protein ARHGAP27 0.050 Rho GTPase activating protein 27 isoform b ARHGAP27 0.050 Rho GTPase activating protein 27 isoform a CHN1 0.048 chimerin (chimaerin) 1 isoform a CHN1 0.048 chimerin (chimaerin) 1 isoform b CHN2 0.046 beta chimerin isoform 2 CHN2 0.046 beta chimerin isoform 1 ARHGAP9 0.046 Rho GTPase activating protein 9 isoform 1 ARHGAP9 0.046 Rho GTPase activating protein 9 isoform 3 ARHGAP12 0.044 Rho GTPase activating protein 12 ARHGAP17 0.043 nadrin isoform 2 ARHGAP15 0.043 ARHGAP15 ARHGAP17 0.043 nadrin isoform 1 SH3BP1 0.042 SH3-domain binding protein 1 FLJ32810 0.037 Rho-type GTPase-activating protein FLJ32810 ABR 0.036 active breakpoint cluster region-related protein i... ABR 0.036 active breakpoint cluster region-related protein is... ABR 0.036 active breakpoint cluster region-related protein is... ARHGAP23 0.036 Rho GTPase activating protein 23 MYO9A 0.034 myosin IXA ARHGAP10 0.033 Rho GTPase activating protein 10 BCR 0.033 breakpoint cluster region isoform 2 BCR 0.033 breakpoint cluster region isoform 1 ARHGAP4 0.032 Rho GTPase activating protein 4 GMIP 0.032 GEM interacting proteinHuman BLASTP results (used to prepare the table) | |||
Gene descriptions are from NCBI RefSeq. Search results were obtained with NCBI BLAST and RefSeq entries. When identical proteins are present, the self-match may not be listed first in BLASTP output. In such cases, the table above has been reordered to place it first.
See About the Figures for the scoring system used in the figure above right. The same scoring system was used in the table of BLASTP results.
Guide to the Human Genome
Copyright © 2010 by Stewart Scherer. All rights reserved.
