
| Name: GPR88 | Sequence: fasta or formatted (384aa) | NCBI GI: 116063556 | |
|
Description: G-protein coupled receptor 88
|
Referenced in:
| ||
|
Composition:
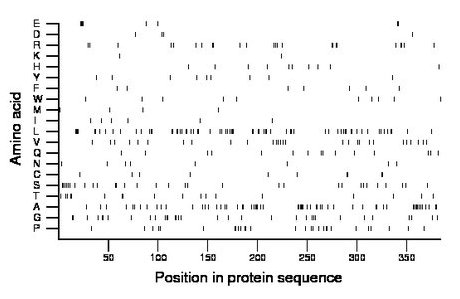
Amino acid Percentage Count Longest homopolymer A alanine 15.9 61 6 C cysteine 2.6 10 2 D aspartate 1.0 4 1 E glutamate 2.1 8 4 F phenylalanine 1.8 7 1 G glycine 8.6 33 2 H histidine 2.6 10 1 I isoleucine 1.6 6 1 K lysine 0.5 2 1 L leucine 17.7 68 4 M methionine 1.0 4 1 N asparagine 2.1 8 1 P proline 7.3 28 2 Q glutamine 3.9 15 1 R arginine 6.2 24 2 S serine 8.1 31 3 T threonine 4.7 18 2 V valine 7.3 28 1 W tryptophan 2.6 10 1 Y tyrosine 2.3 9 1 |
Comparative genomics:
Search single species RefSeq proteins at NCBI
Search summary 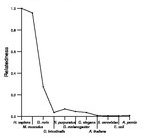
Figure data | ||
Related human proteins:Protein Relative score Description Self-match 1.000 G-protein coupled receptor 88 ADRB3 0.061 adrenergic, beta-3-, receptor ADRB1 0.059 beta-1-adrenergic receptor HTR1D 0.058 5-hydroxytryptamine (serotonin) receptor 1D GPR135 0.050 G protein-coupled receptor 135 ADRA1D 0.048 alpha-1D-adrenergic receptor HTR6 0.044 5-hydroxytryptamine (serotonin) receptor 6 MTNR1B 0.040 melatonin receptor 1B SSTR5 0.040 somatostatin receptor 5 HTR1B 0.039 5-hydroxytryptamine (serotonin) receptor 1B SSTR4 0.039 somatostatin receptor 4 NPFFR1 0.038 neuropeptide FF receptor 1 CCKBR 0.036 cholecystokinin B receptor OPN4 0.036 opsin 4 isoform 1 ADRA1A 0.035 alpha-1A-adrenergic receptor isoform 4 ADRA1A 0.035 alpha-1A-adrenergic receptor isoform 1 ADRA1A 0.035 alpha-1A-adrenergic receptor isoform 2 ADRA1A 0.035 alpha-1A-adrenergic receptor isoform 3 HTR1A 0.034 5-hydroxytryptamine (serotonin) receptor 1A ADRB2 0.034 adrenergic, beta-2-, receptor, surface DRD3 0.032 dopamine receptor D3 isoform e GPR84 0.032 G protein-coupled receptor 84 S1PR4 0.032 sphingosine-1-phosphate receptor 4 precursor PRLHR 0.031 G protein-coupled receptor 10 MTNR1A 0.031 melatonin receptor 1A DRD1 0.030 dopamine receptor D1 ADORA2A 0.030 adenosine A2a receptor GPR50 0.028 G protein-coupled receptor 50 GALR3 0.028 galanin receptor 3 GALR2 0.028 galanin receptor 2Human BLASTP results (used to prepare the table) | |||
Gene descriptions are from NCBI RefSeq. Search results were obtained with NCBI BLAST and RefSeq entries. When identical proteins are present, the self-match may not be listed first in BLASTP output. In such cases, the table above has been reordered to place it first.
See About the Figures for the scoring system used in the figure above right. The same scoring system was used in the table of BLASTP results.
Guide to the Human Genome
Copyright © 2010 by Stewart Scherer. All rights reserved.
