
| Name: TBC1D7 | Sequence: fasta or formatted (266aa) | NCBI GI: 221139909 | |
|
Description: TBC1 domain family, member 7 isoform b
|
Referenced in:
| ||
Other entries for this name:
alt prot [293aa] TBC1 domain family, member 7 isoform a alt prot [293aa] TBC1 domain family, member 7 isoform a alt prot [293aa] TBC1 domain family, member 7 isoform a | |||
|
Composition:
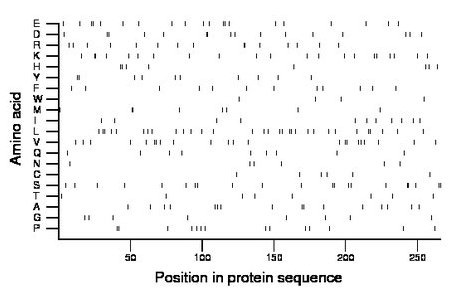
Amino acid Percentage Count Longest homopolymer A alanine 6.0 16 2 C cysteine 2.3 6 1 D aspartate 6.0 16 2 E glutamate 7.5 20 2 F phenylalanine 4.5 12 1 G glycine 3.0 8 1 H histidine 3.0 8 2 I isoleucine 4.1 11 1 K lysine 7.9 21 2 L leucine 11.7 31 2 M methionine 3.0 8 2 N asparagine 2.3 6 1 P proline 5.3 14 2 Q glutamine 3.4 9 1 R arginine 5.6 15 2 S serine 7.9 21 2 T threonine 3.0 8 1 V valine 8.3 22 2 W tryptophan 1.5 4 1 Y tyrosine 3.8 10 2 |
Comparative genomics:
Search single species RefSeq proteins at NCBI
Search summary 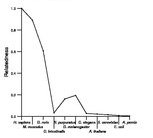
Figure data | ||
Related human proteins:Protein Relative score Description Self-match 1.000 TBC1 domain family, member 7 isoform b TBC1D7 0.971 TBC1 domain family, member 7 isoform a TBC1D7 0.971 TBC1 domain family, member 7 isoform a TBC1D7 0.971 TBC1 domain family, member 7 isoform a TBCKL 0.029 TBC domain-containing protein kinase-like TBC1D10B 0.027 TBC1 domain family, member 10B TBC1D4 0.027 TBC1 domain family, member 4 TBC1D19 0.019 TBC1 domain family, member 19 TBC1D30 0.019 PREDICTED: TBC1 domain family, member 30 TBC1D30 0.019 PREDICTED: TBC1 domain family, member 30 TBC1D30 0.019 PREDICTED: TBC1 domain family, member 30 TBC1D10C 0.019 TBC1 domain family, member 10C USP6NL 0.019 USP6 N-terminal like isoform 1 USP6NL 0.019 USP6 N-terminal like isoform 2 TBC1D10A 0.016 TBC1 domain family, member 10A TBC1D1 0.016 TBC1 (tre-2/USP6, BUB2, cdc16) domain family, member... EVI5L 0.014 ecotropic viral integration site 5-like isoform 1 [... EVI5L 0.014 ecotropic viral integration site 5-like isoform 2 [H... TBC1D16 0.010 TBC1 domain family, member 16 GRTP1 0.010 growth hormone regulated TBC protein 1 TBC1D23 0.010 TBC1 domain family, member 23 VANGL2 0.008 vang-like 2 ARHGEF9 0.008 Cdc42 guanine exchange factor 9 SGSM3 0.008 small G protein signaling modulator 3 TBC1D2 0.006 TBC1 domain family, member 2Human BLASTP results (used to prepare the table) | |||
Gene descriptions are from NCBI RefSeq. Search results were obtained with NCBI BLAST and RefSeq entries. When identical proteins are present, the self-match may not be listed first in BLASTP output. In such cases, the table above has been reordered to place it first.
See About the Figures for the scoring system used in the figure above right. The same scoring system was used in the table of BLASTP results.
Guide to the Human Genome
Copyright © 2010 by Stewart Scherer. All rights reserved.
