
| Name: TOR2A | Sequence: fasta or formatted (242aa) | NCBI GI: 197313700 | |
|
Description: torsin family 2, member A isoform c
|
Referenced in:
| ||
Other entries for this name:
alt prot [253aa] torsin family 2, member A isoform b alt prot [321aa] torsin family 2, member A isoform a alt prot [72aa] torsin family 2, member A isoform d | |||
|
Composition:
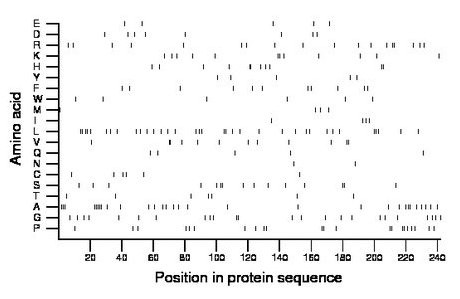
Amino acid Percentage Count Longest homopolymer A alanine 12.4 30 5 C cysteine 2.5 6 1 D aspartate 3.3 8 1 E glutamate 2.1 5 1 F phenylalanine 4.5 11 1 G glycine 9.9 24 2 H histidine 4.5 11 2 I isoleucine 1.7 4 1 K lysine 5.0 12 2 L leucine 14.5 35 2 M methionine 1.7 4 1 N asparagine 0.8 2 1 P proline 9.1 22 2 Q glutamine 2.1 5 1 R arginine 7.4 18 2 S serine 6.2 15 2 T threonine 2.9 7 1 V valine 5.0 12 2 W tryptophan 2.5 6 1 Y tyrosine 2.1 5 1 |
Comparative genomics:
Search single species RefSeq proteins at NCBI
Search summary 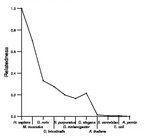
Figure data | ||
Related human proteins:Protein Relative score Description Self-match 1.000 torsin family 2, member A isoform c TOR2A 0.817 torsin family 2, member A isoform b TOR2A 0.803 torsin family 2, member A isoform a TOR1A 0.299 torsin A TOR1B 0.278 torsin family 1, member B (torsin B) TOR3A 0.210 torsin family 3, member A TOR2A 0.172 torsin family 2, member A isoform d C9orf167 0.058 hypothetical protein LOC54863 DRD4 0.025 dopamine receptor D4 ZNF48 0.017 zinc finger protein 48 TBC1D10B 0.017 TBC1 domain family, member 10B TRIM71 0.017 tripartite motif-containing 71 GPN1 0.015 GPN-loop GTPase 1 isoform a LEMD2 0.015 LEM domain containing 2 isoform 1 GLTSCR1 0.015 glioma tumor suppressor candidate region gene 1 [Ho... TRDN 0.015 triadin APC2 0.015 adenomatosis polyposis coli 2 PUS1 0.012 pseudouridine synthase 1 isoform 1 CLPB 0.012 caseinolytic peptidase B C9orf75 0.012 hypothetical protein LOC286262 isoform 2 C9orf75 0.012 hypothetical protein LOC286262 isoform 1 LOC100133554 0.012 PREDICTED: hypothetical protein LOC100133554 0.012 PREDICTED: hypothetical protein WIPF3 0.012 WAS/WASL interacting protein family, member 3 [Homo... FOXQ1 0.010 forkhead box Q1 ARTN 0.010 neurotrophic factor artemin isoform 2 ARTN 0.010 neurotrophic factor artemin isoform 1 precursor [Ho... ARTN 0.010 neurotrophic factor artemin isoform 3 precursor [Ho... ARTN 0.010 neurotrophic factor artemin isoform 1 precursor [Ho... ARTN 0.010 neurotrophic factor artemin isoform 3 precursor [Ho...Human BLASTP results (used to prepare the table) | |||
Gene descriptions are from NCBI RefSeq. Search results were obtained with NCBI BLAST and RefSeq entries. When identical proteins are present, the self-match may not be listed first in BLASTP output. In such cases, the table above has been reordered to place it first.
See About the Figures for the scoring system used in the figure above right. The same scoring system was used in the table of BLASTP results.
Guide to the Human Genome
Copyright © 2010 by Stewart Scherer. All rights reserved.
