
| Name: BBC3 | Sequence: fasta or formatted (131aa) | NCBI GI: 187829742 | |
|
Description: BCL2 binding component 3 isoform 2
|
Referenced in: BCL2 Pathways, Caspases, and Programmed Cell Death
| ||
Other entries for this name:
alt prot [193aa] BCL2 binding component 3 isoform 4 alt prot [261aa] BCL2 binding component 3 isoform 1 alt prot [101aa] BCL2 binding component 3 isoform 3 | |||
|
Composition:
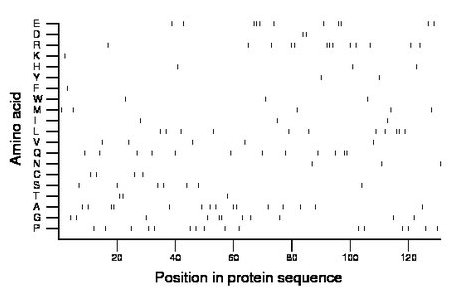
Amino acid Percentage Count Longest homopolymer A alanine 11.5 15 2 C cysteine 3.1 4 1 D aspartate 1.5 2 2 E glutamate 8.4 11 3 F phenylalanine 0.8 1 1 G glycine 8.4 11 2 H histidine 2.3 3 1 I isoleucine 2.3 3 1 K lysine 0.8 1 1 L leucine 8.4 11 2 M methionine 3.8 5 1 N asparagine 2.3 3 1 P proline 12.2 16 1 Q glutamine 9.2 12 2 R arginine 9.9 13 3 S serine 5.3 7 1 T threonine 2.3 3 2 V valine 3.8 5 1 W tryptophan 2.3 3 1 Y tyrosine 1.5 2 1 |
Comparative genomics:
Search single species RefSeq proteins at NCBI
Search summary 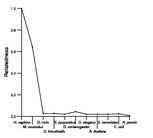
Figure data | ||
Related human proteins:Protein Relative score Description Self-match 1.000 BCL2 binding component 3 isoform 2 BBC3 0.743 BCL2 binding component 3 isoform 4 BBC3 0.217 BCL2 binding component 3 isoform 1 BBC3 0.209 BCL2 binding component 3 isoform 3 MAML2 0.051 mastermind-like 2 ESPN 0.043 espin BMP6 0.028 bone morphogenetic protein 6 preproprotein TCHH 0.028 trichohyalin FLJ22184 0.028 PREDICTED: hypothetical protein FLJ22184 FLJ22184 0.028 PREDICTED: hypothetical protein LOC80164 NAV2 0.028 neuron navigator 2 isoform 3 NAV2 0.028 neuron navigator 2 isoform 1 NAV2 0.028 neuron navigator 2 isoform 2 FLJ22184 0.028 PREDICTED: hypothetical protein FLJ22184 CHD3 0.028 chromodomain helicase DNA binding protein 3 isoform ... CHD3 0.028 chromodomain helicase DNA binding protein 3 isoform... C20orf165 0.020 chromosome 20 open reading frame 165 SALL3 0.020 sal-like 3 MAGED4B 0.020 melanoma antigen family D, 4B isoform 2 MAGED4B 0.020 melanoma antigen family D, 4B isoform 1 MAGED4B 0.020 melanoma antigen family D, 4B isoform 1 MAP7 0.020 microtubule-associated protein 7 FOXE3 0.020 forkhead box E3 MAGED4 0.020 melanoma antigen family D, 4 CCBE1 0.020 collagen and calcium binding EGF domains 1 C11orf9 0.020 hypothetical protein LOC745 isoform 1 C11orf9 0.020 hypothetical protein LOC745 isoform 2 KBTBD11 0.020 kelch repeat and BTB (POZ) domain containing 11 [Homo... DMD 0.016 dystrophin Dp427c isoform CCDC102A 0.016 coiled-coil domain containing 102AHuman BLASTP results (used to prepare the table) | |||
Gene descriptions are from NCBI RefSeq. Search results were obtained with NCBI BLAST and RefSeq entries. When identical proteins are present, the self-match may not be listed first in BLASTP output. In such cases, the table above has been reordered to place it first.
See About the Figures for the scoring system used in the figure above right. The same scoring system was used in the table of BLASTP results.
Guide to the Human Genome
Copyright © 2010 by Stewart Scherer. All rights reserved.
