
| Name: LOC650621 | Sequence: fasta or formatted (430aa) | NCBI GI: 169218008 | |
|
Description: PREDICTED: similar to anaphase-promoting complex subunit 2
| Not currently referenced in the text | ||
|
Composition:
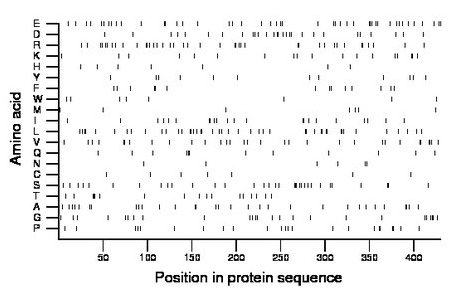
Amino acid Percentage Count Longest homopolymer A alanine 7.2 31 2 C cysteine 1.6 7 1 D aspartate 6.5 28 2 E glutamate 10.5 45 2 F phenylalanine 3.3 14 2 G glycine 5.8 25 2 H histidine 1.6 7 1 I isoleucine 5.1 22 2 K lysine 4.2 18 2 L leucine 10.2 44 2 M methionine 1.6 7 1 N asparagine 1.4 6 1 P proline 5.3 23 2 Q glutamine 2.8 12 2 R arginine 9.3 40 2 S serine 7.7 33 3 T threonine 4.0 17 3 V valine 7.2 31 2 W tryptophan 1.9 8 1 Y tyrosine 2.8 12 1 |
Comparative genomics:
Search single species RefSeq proteins at NCBI
Search summary 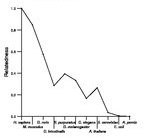
Figure data | ||
Related human proteins:Protein Relative score Description Self-match 1.000 PREDICTED: similar to anaphase-promoting complex su... ANAPC2 0.875 anaphase-promoting complex subunit 2 CUL4A 0.018 cullin 4A isoform 1 CUL4A 0.018 cullin 4A isoform 2 CUL1 0.017 cullin 1 CUL3 0.013 cullin 3 CUL4B 0.011 cullin 4B isoform 2 CUL4B 0.011 cullin 4B isoform 1 CUL2 0.010 cullin 2 PROM1 0.008 prominin 1 isoform 2 PROM1 0.008 prominin 1 isoform 4 PROM1 0.008 prominin 1 isoform 5 PROM1 0.008 prominin 1 isoform 6 PROM1 0.008 prominin 1 isoform 7 PROM1 0.008 prominin 1 isoform 2 PROM1 0.008 prominin 1 isoform 1 ITGA10 0.008 integrin, alpha 10 precursor GAK 0.007 cyclin G associated kinase ANKRD11 0.007 ankyrin repeat domain 11 RNF19B 0.007 ring finger protein 19B isoform a TAF1 0.006 TBP-associated factor 1 isoform 2 TAF1 0.006 TBP-associated factor 1 isoform 1 TAF1L 0.006 TBP-associated factor RNA polymerase 1-like MLL 0.006 myeloid/lymphoid or mixed-lineage leukemia protein [... USP31 0.006 ubiquitin specific peptidase 31 CEBPZ 0.006 CCAAT/enhancer binding protein zeta ARMCX3 0.006 armadillo repeat containing, X-linked 3 ARMCX3 0.006 armadillo repeat containing, X-linked 3 ARMCX3 0.006 armadillo repeat containing, X-linked 3 TNFRSF10A 0.005 tumor necrosis factor receptor superfamily, member 1...Human BLASTP results (used to prepare the table) | |||
Gene descriptions are from NCBI RefSeq. Search results were obtained with NCBI BLAST and RefSeq entries. When identical proteins are present, the self-match may not be listed first in BLASTP output. In such cases, the table above has been reordered to place it first.
See About the Figures for the scoring system used in the figure above right. The same scoring system was used in the table of BLASTP results.
Guide to the Human Genome
Copyright © 2010 by Stewart Scherer. All rights reserved.
