
| Name: POU2AF1 | Sequence: fasta or formatted (256aa) | NCBI GI: 167900478 | |
|
Description: POU class 2 associating factor 1
|
Referenced in:
| ||
|
Composition:
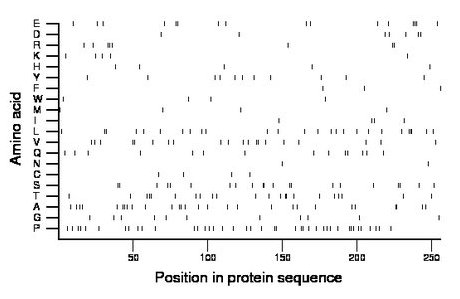
Amino acid Percentage Count Longest homopolymer A alanine 10.9 28 2 C cysteine 1.6 4 1 D aspartate 2.7 7 1 E glutamate 6.2 16 3 F phenylalanine 1.2 3 1 G glycine 4.3 11 1 H histidine 2.0 5 1 I isoleucine 1.6 4 1 K lysine 2.0 5 1 L leucine 10.2 26 3 M methionine 1.6 4 1 N asparagine 0.8 2 1 P proline 16.0 41 2 Q glutamine 5.5 14 1 R arginine 3.1 8 2 S serine 8.2 21 2 T threonine 8.6 22 2 V valine 7.8 20 2 W tryptophan 1.6 4 1 Y tyrosine 4.3 11 1 |
Comparative genomics:
Search single species RefSeq proteins at NCBI
Search summary 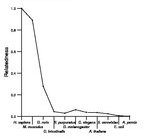
Figure data | ||
Related human proteins:Protein Relative score Description Self-match 1.000 POU class 2 associating factor 1 MUC2 0.050 mucin 2 precursor MLL2 0.042 myeloid/lymphoid or mixed-lineage leukemia 2 NACA 0.040 nascent polypeptide-associated complex alpha subuni... TTN 0.034 titin isoform N2-A MAPK7 0.032 mitogen-activated protein kinase 7 isoform 1 MAPK7 0.032 mitogen-activated protein kinase 7 isoform 1 MAPK7 0.032 mitogen-activated protein kinase 7 isoform 1 MAPK7 0.032 mitogen-activated protein kinase 7 isoform 2 PTPN23 0.030 protein tyrosine phosphatase, non-receptor type 23 [... CBLL1 0.030 Cas-Br-M (murine) ecotropic retroviral transforming... FLJ22184 0.028 PREDICTED: hypothetical protein FLJ22184 LOC100294420 0.028 PREDICTED: similar to mucin 2 GLTSCR1 0.028 glioma tumor suppressor candidate region gene 1 [Ho... FLJ22184 0.028 PREDICTED: hypothetical protein FLJ22184 FLJ22184 0.028 PREDICTED: hypothetical protein LOC80164 ZYX 0.028 zyxin ZYX 0.028 zyxin BAT2D1 0.028 HBxAg transactivated protein 2 ARAP1 0.026 ArfGAP with RhoGAP domain, ankyrin repeat and PH dom... INF2 0.024 inverted formin 2 isoform 2 INF2 0.024 inverted formin 2 isoform 1 DAB1 0.024 disabled homolog 1 CIC 0.024 capicua homolog KRTAP4-6 0.024 PREDICTED: keratin associated protein 4.6 LOC100132351 0.024 PREDICTED: hypothetical protein ARID1A 0.024 AT rich interactive domain 1A isoform a ARID1A 0.024 AT rich interactive domain 1A isoform b YLPM1 0.024 YLP motif containing 1 PRR12 0.024 proline rich 12Human BLASTP results (used to prepare the table) | |||
Gene descriptions are from NCBI RefSeq. Search results were obtained with NCBI BLAST and RefSeq entries. When identical proteins are present, the self-match may not be listed first in BLASTP output. In such cases, the table above has been reordered to place it first.
See About the Figures for the scoring system used in the figure above right. The same scoring system was used in the table of BLASTP results.
Guide to the Human Genome
Copyright © 2010 by Stewart Scherer. All rights reserved.
