
| Name: CARD6 | Sequence: fasta or formatted (1037aa) | NCBI GI: 16554564 | |
|
Description: caspase recruitment domain family, member 6
|
Referenced in: BCL2 Pathways, Caspases, and Programmed Cell Death
| ||
|
Composition:
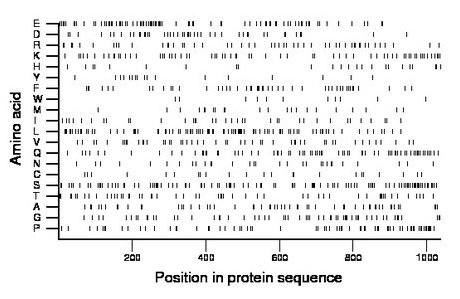
Amino acid Percentage Count Longest homopolymer A alanine 5.6 58 3 C cysteine 2.2 23 1 D aspartate 4.5 47 2 E glutamate 8.6 89 3 F phenylalanine 4.8 50 3 G glycine 5.6 58 2 H histidine 2.3 24 2 I isoleucine 3.6 37 2 K lysine 6.7 69 2 L leucine 9.3 96 3 M methionine 2.3 24 2 N asparagine 2.9 30 2 P proline 6.8 70 2 Q glutamine 7.0 73 2 R arginine 5.0 52 2 S serine 10.3 107 3 T threonine 5.1 53 2 V valine 4.7 49 1 W tryptophan 1.1 11 1 Y tyrosine 1.6 17 1 |
Comparative genomics:
Search single species RefSeq proteins at NCBI
Search summary 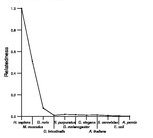
Figure data | ||
Related human proteins:Protein Relative score Description Self-match 1.000 caspase recruitment domain family, member 6 URG4 0.095 up-regulated gene 4 isoform 1 URG4 0.095 up-regulated gene 4 isoform 3 URG4 0.094 up-regulated gene 4 isoform 2 NOL3 0.025 nucleolar protein 3 PCLO 0.015 piccolo isoform 2 PCLO 0.015 piccolo isoform 1 TBKBP1 0.013 TBK1 binding protein 1 ARID1A 0.012 AT rich interactive domain 1A isoform a ARID1A 0.012 AT rich interactive domain 1A isoform b UMODL1 0.012 uromodulin-like 1 isoform 2 precursor BPTF 0.012 bromodomain PHD finger transcription factor isoform ... BPTF 0.012 bromodomain PHD finger transcription factor isoform ... ZNF828 0.010 zinc finger protein 828 COL27A1 0.010 collagen, type XXVII, alpha 1 USP31 0.010 ubiquitin specific peptidase 31 MYST3 0.009 MYST histone acetyltransferase (monocytic leukemia)... MYST3 0.009 MYST histone acetyltransferase (monocytic leukemia)... MYST3 0.009 MYST histone acetyltransferase (monocytic leukemia)... POU6F2 0.009 POU domain, class 6, transcription factor 2 ARHGAP17 0.009 nadrin isoform 1 ARHGAP17 0.009 nadrin isoform 2 FLJ32682 0.009 hypothetical protein LOC220081 BAT2D1 0.009 HBxAg transactivated protein 2 SRRM2 0.009 splicing coactivator subunit SRm300 SPEG 0.008 SPEG complex locus SATL1 0.008 spermidine/spermine N1-acetyl transferase-like 1 [Ho... PRG4 0.008 proteoglycan 4 isoform D PRG4 0.008 proteoglycan 4 isoform C PRG4 0.008 proteoglycan 4 isoform BHuman BLASTP results (used to prepare the table) | |||
Gene descriptions are from NCBI RefSeq. Search results were obtained with NCBI BLAST and RefSeq entries. When identical proteins are present, the self-match may not be listed first in BLASTP output. In such cases, the table above has been reordered to place it first.
See About the Figures for the scoring system used in the figure above right. The same scoring system was used in the table of BLASTP results.
Guide to the Human Genome
Copyright © 2010 by Stewart Scherer. All rights reserved.
