
| Name: CASC3 | Sequence: fasta or formatted (703aa) | NCBI GI: 15721939 | |
|
Description: metastatic lymph node 51
| Not currently referenced in the text | ||
|
Composition:
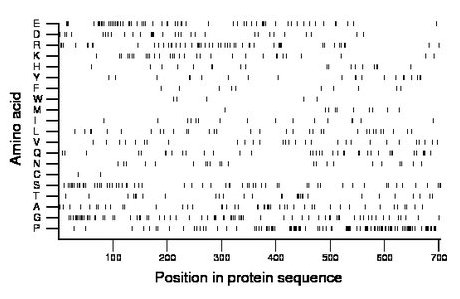
Amino acid Percentage Count Longest homopolymer A alanine 6.7 47 3 C cysteine 0.3 2 1 D aspartate 4.6 32 3 E glutamate 9.1 64 3 F phenylalanine 1.6 11 2 G glycine 10.7 75 4 H histidine 2.6 18 1 I isoleucine 2.3 16 1 K lysine 4.6 32 2 L leucine 4.8 34 2 M methionine 1.6 11 1 N asparagine 3.1 22 1 P proline 14.4 101 6 Q glutamine 5.4 38 3 R arginine 7.7 54 3 S serine 8.7 61 2 T threonine 4.1 29 2 V valine 4.3 30 2 W tryptophan 0.7 5 1 Y tyrosine 3.0 21 2 |
Comparative genomics:
Search single species RefSeq proteins at NCBI
Search summary 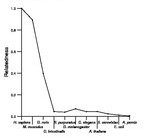
Figure data | ||
Related human proteins:Protein Relative score Description Self-match 1.000 metastatic lymph node 51 SF3A2 0.042 splicing factor 3a, subunit 2 RBM33 0.039 RNA binding motif protein 33 YLPM1 0.038 YLP motif containing 1 FMN2 0.035 formin 2 PCLO 0.033 piccolo isoform 2 PCLO 0.033 piccolo isoform 1 PTPN23 0.033 protein tyrosine phosphatase, non-receptor type 23 [... CCNK 0.031 cyclin K isoform 1 RERE 0.029 atrophin-1 like protein isoform b RERE 0.029 atrophin-1 like protein isoform a RERE 0.029 atrophin-1 like protein isoform a BRD4 0.029 bromodomain-containing protein 4 isoform long MLL2 0.029 myeloid/lymphoid or mixed-lineage leukemia 2 MBD6 0.028 methyl-CpG binding domain protein 6 NACA 0.028 nascent polypeptide-associated complex alpha subuni... FLJ22184 0.028 PREDICTED: hypothetical protein FLJ22184 KIAA1522 0.027 hypothetical protein LOC57648 FLJ22184 0.027 PREDICTED: hypothetical protein FLJ22184 RAPH1 0.027 Ras association and pleckstrin homology domains 1 is... FLJ22184 0.027 PREDICTED: hypothetical protein LOC80164 WIPF2 0.026 WIRE protein GLTSCR1 0.026 glioma tumor suppressor candidate region gene 1 [Ho... PRB3 0.026 proline-rich protein BstNI subfamily 3 precursor [H... SFRS15 0.026 splicing factor, arginine/serine-rich 15 isoform 3 ... FMNL1 0.026 formin-like 1 PRR12 0.026 proline rich 12 PRB1 0.024 proline-rich protein BstNI subfamily 1 isoform 1 pre... SF3B4 0.024 splicing factor 3b, subunit 4 WIPF1 0.024 WAS/WASL interacting protein family, member 1 [Homo...Human BLASTP results (used to prepare the table) | |||
Gene descriptions are from NCBI RefSeq. Search results were obtained with NCBI BLAST and RefSeq entries. When identical proteins are present, the self-match may not be listed first in BLASTP output. In such cases, the table above has been reordered to place it first.
See About the Figures for the scoring system used in the figure above right. The same scoring system was used in the table of BLASTP results.
Guide to the Human Genome
Copyright © 2010 by Stewart Scherer. All rights reserved.
