
| Name: KNG1 | Sequence: fasta or formatted (644aa) | NCBI GI: 156231037 | |
|
Description: kininogen 1 isoform 1
|
Referenced in: Peptide and Protein G-coupled Signals
| ||
Other entries for this name:
alt prot [427aa] kininogen 1 isoform 2 | |||
|
Composition:
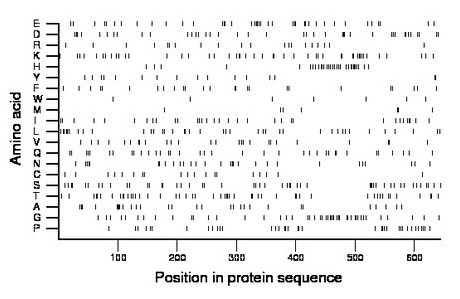
Amino acid Percentage Count Longest homopolymer A alanine 4.5 29 2 C cysteine 3.0 19 1 D aspartate 6.4 41 3 E glutamate 6.4 41 2 F phenylalanine 3.9 25 1 G glycine 7.1 46 2 H histidine 4.8 31 1 I isoleucine 5.1 33 1 K lysine 7.9 51 2 L leucine 6.2 40 3 M methionine 1.2 8 2 N asparagine 4.7 30 3 P proline 6.1 39 2 Q glutamine 5.6 36 2 R arginine 3.3 21 2 S serine 7.8 50 3 T threonine 8.1 52 2 V valine 4.5 29 2 W tryptophan 1.1 7 1 Y tyrosine 2.5 16 2 |
Comparative genomics:
Search single species RefSeq proteins at NCBI
Search summary 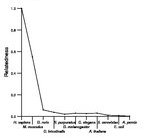
Figure data | ||
Related human proteins:Protein Relative score Description Self-match 1.000 kininogen 1 isoform 1 KNG1 0.602 kininogen 1 isoform 2 CST7 0.031 cystatin F FETUB 0.031 fetuin B SLC39A7 0.026 solute carrier family 39, member 7 SLC39A7 0.026 solute carrier family 39, member 7 CST6 0.023 cystatin M precursor CST3 0.021 cystatin C precursor CST2 0.020 cystatin SA precursor SLC30A7 0.019 zinc transporter like 2 SLC30A7 0.019 zinc transporter like 2 CSTL1 0.017 cystatin-like 1 precursor CST1 0.016 cystatin SN precursor CST4 0.016 cystatin S precursor FLG 0.015 filaggrin HRG 0.015 histidine-rich glycoprotein precursor RPGR 0.014 retinitis pigmentosa GTPase regulator isoform C [Hom... HRC 0.014 histidine rich calcium binding protein precursor [Hom... CREB5 0.014 cAMP responsive element binding protein 5 isoform de... CREB5 0.014 cAMP responsive element binding protein 5 isoform be... CREB5 0.014 cAMP responsive element binding protein 5 isoform ga... CREB5 0.014 cAMP responsive element binding protein 5 isoform al... AHSG 0.014 alpha-2-HS-glycoprotein HRNR 0.013 hornerin LOC100294204 0.011 PREDICTED: hypothetical protein AUTS2 0.011 autism susceptibility candidate 2 isoform 2 AUTS2 0.011 autism susceptibility candidate 2 isoform 1 FAM71B 0.011 family with sequence similarity 71, member B LOC729792 0.011 PREDICTED: hypothetical protein LOC729792 0.011 PREDICTED: hypothetical proteinHuman BLASTP results (used to prepare the table) | |||
Gene descriptions are from NCBI RefSeq. Search results were obtained with NCBI BLAST and RefSeq entries. When identical proteins are present, the self-match may not be listed first in BLASTP output. In such cases, the table above has been reordered to place it first.
See About the Figures for the scoring system used in the figure above right. The same scoring system was used in the table of BLASTP results.
Guide to the Human Genome
Copyright © 2010 by Stewart Scherer. All rights reserved.
