| Name: C2orf40 | Sequence: fasta or formatted (148aa) | NCBI GI: 14165276 | |
|
Description: esophageal cancer related gene 4 protein
|
Referenced in: Stomach, Small Intestine, and Colon
| ||
|
Composition:

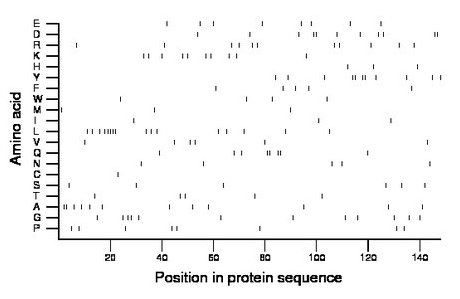
Amino acid Percentage Count Longest homopolymer A alanine 8.1 12 2 C cysteine 0.7 1 1 D aspartate 7.4 11 2 E glutamate 5.4 8 1 F phenylalanine 3.4 5 1 G glycine 8.1 12 2 H histidine 2.0 3 1 I isoleucine 2.0 3 1 K lysine 6.8 10 1 L leucine 10.8 16 5 M methionine 2.0 3 1 N asparagine 3.4 5 1 P proline 5.4 8 1 Q glutamine 5.4 8 2 R arginine 7.4 11 1 S serine 4.1 6 1 T threonine 3.4 5 1 V valine 4.1 6 1 W tryptophan 2.7 4 1 Y tyrosine 7.4 11 2 |
Comparative genomics:
Search single species RefSeq proteins at NCBI
Search summary 
Figure data | ||
Related human proteins:Protein Relative score Description Self-match 1.000 esophageal cancer related gene 4 protein CDC45L 0.024 CDC45-like C1orf128 0.024 chromosome 1 open reading frame 128 KCNK10 0.021 potassium channel, subfamily K, member 10 isoform 3 ... KCNK10 0.021 potassium channel, subfamily K, member 10 isoform 2 ... KCNK10 0.021 potassium channel, subfamily K, member 10 isoform 1 ... FCHSD1 0.017 FCH and double SH3 domains 1 ASTN1 0.010 astrotactin isoform 1 ASTN1 0.010 astrotactin isoform 2 LOC100293842 0.010 PREDICTED: similar to SLC29A4 protein LOC402269 0.010 PREDICTED: similar to SLC29A4 protein LOC100287294 0.010 PREDICTED: hypothetical protein XP_002342767 LOC402269 0.010 PREDICTED: similar to SLC29A4 protein LOC728500 0.010 PREDICTED: similar to SLC29A4 protein CHIA 0.007 acidic chitinase isoform c CHIA 0.007 acidic chitinase isoform a EFNA3 0.007 ephrin A3 SKI 0.007 v-ski sarcoma viral oncogene homolog ITCH 0.007 itchy homolog E3 ubiquitin protein ligase FMOD 0.007 fibromodulin precursor ATG2B 0.007 ATG2 autophagy related 2 homolog B C1orf94 0.007 hypothetical protein LOC84970 isoform b C1orf94 0.007 hypothetical protein LOC84970 isoform a CLMN 0.007 calmin COBL 0.007 cordon-bleu homologHuman BLASTP results (used to prepare the table) | |||
Gene descriptions are from NCBI RefSeq. Search results were obtained with NCBI BLAST and RefSeq entries. When identical proteins are present, the self-match may not be listed first in BLASTP output. In such cases, the table above has been reordered to place it first.
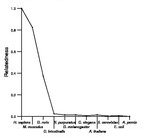
See About the Figures for the scoring system used in the figure above right. The same scoring system was used in the table of BLASTP results.
Guide to the Human Genome
Copyright © 2010 by Stewart Scherer. All rights reserved.
