
| Name: ATG2B | Sequence: fasta or formatted (2078aa) | NCBI GI: 118197272 | |
|
Description: ATG2 autophagy related 2 homolog B
|
Referenced in:
| ||
|
Composition:
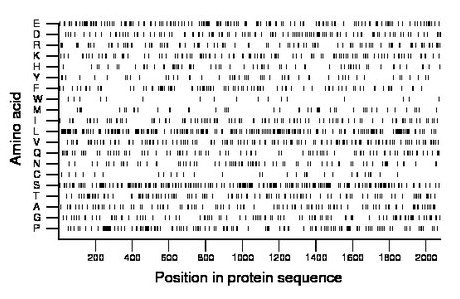
Amino acid Percentage Count Longest homopolymer A alanine 5.2 109 3 C cysteine 1.6 33 2 D aspartate 5.5 115 2 E glutamate 7.5 156 5 F phenylalanine 4.5 94 2 G glycine 5.1 106 2 H histidine 3.2 66 2 I isoleucine 4.7 98 2 K lysine 5.0 104 3 L leucine 10.3 214 3 M methionine 2.4 49 2 N asparagine 3.5 72 1 P proline 6.5 135 2 Q glutamine 4.3 89 2 R arginine 4.8 100 2 S serine 10.6 221 3 T threonine 5.5 115 2 V valine 6.3 131 2 W tryptophan 0.9 18 1 Y tyrosine 2.6 53 2 |
Comparative genomics:
Search single species RefSeq proteins at NCBI
Search summary 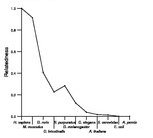
Figure data | ||
Related human proteins:Protein Relative score Description Self-match 1.000 ATG2 autophagy related 2 homolog B ATG2A 0.345 autophagy related 2A VPS13C 0.007 vacuolar protein sorting 13C protein isoform 1A [Hom... VPS13C 0.007 vacuolar protein sorting 13C protein isoform 1B [Hom... VPS13D 0.006 vacuolar protein sorting 13D isoform 2 VPS13D 0.006 vacuolar protein sorting 13D isoform 1 VPS13C 0.005 vacuolar protein sorting 13C protein isoform 2B [Hom... VPS13C 0.005 vacuolar protein sorting 13C protein isoform 2A [Hom... VPS13A 0.004 vacuolar protein sorting 13A isoform B VPS13A 0.004 vacuolar protein sorting 13A isoform D VPS13A 0.004 vacuolar protein sorting 13A isoform A VPS13A 0.004 vacuolar protein sorting 13A isoform C UHRF1BP1 0.002 ICBP90 binding protein 1 RGNEF 0.002 Rho-guanine nucleotide exchange factor UHRF1BP1L 0.002 UHRF1 (ICBP90) binding protein 1-like isoform b [Hom... UHRF1BP1L 0.002 UHRF1 (ICBP90) binding protein 1-like isoform a [Hom... SLK 0.002 serine/threonine kinase 2 LEKR1 0.002 leucine, glutamate and lysine rich 1 KIF21B 0.002 kinesin family member 21B CLSTN1 0.002 calsyntenin 1 isoform 1 CLSTN1 0.002 calsyntenin 1 isoform 2 SPATA7 0.002 spermatogenesis-associated protein 7 isoform a [Homo... TBC1D10A 0.002 TBC1 domain family, member 10A SAPS1 0.002 SAPS domain family, member 1 DCTN2 0.002 dynactin 2 LOC100133790 0.002 PREDICTED: intestinal mucin-like, partial PHLDB2 0.002 pleckstrin homology-like domain, family B, member 2... PHLDB2 0.002 pleckstrin homology-like domain, family B, member 2...Human BLASTP results (used to prepare the table) | |||
Gene descriptions are from NCBI RefSeq. Search results were obtained with NCBI BLAST and RefSeq entries. When identical proteins are present, the self-match may not be listed first in BLASTP output. In such cases, the table above has been reordered to place it first.
See About the Figures for the scoring system used in the figure above right. The same scoring system was used in the table of BLASTP results.
Guide to the Human Genome
Copyright © 2010 by Stewart Scherer. All rights reserved.
