
| Name: ACN9 | Sequence: fasta or formatted (125aa) | NCBI GI: 9910180 | |
|
Description: ACN9 homolog
|
Referenced in:
| ||
|
Composition:
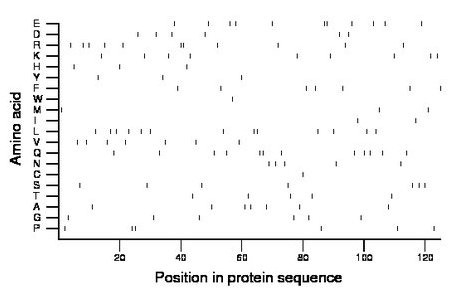
Amino acid Percentage Count Longest homopolymer A alanine 5.6 7 1 C cysteine 0.8 1 1 D aspartate 4.8 6 1 E glutamate 8.8 11 2 F phenylalanine 5.6 7 1 G glycine 4.8 6 1 H histidine 2.4 3 1 I isoleucine 1.6 2 1 K lysine 7.2 9 1 L leucine 10.4 13 2 M methionine 2.4 3 1 N asparagine 4.0 5 1 P proline 4.8 6 2 Q glutamine 9.6 12 2 R arginine 8.8 11 2 S serine 5.6 7 1 T threonine 4.0 5 1 V valine 5.6 7 1 W tryptophan 0.8 1 1 Y tyrosine 2.4 3 1 |
Comparative genomics:
Search single species RefSeq proteins at NCBI
Search summary 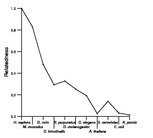
Figure data | ||
Related human proteins:Protein Relative score Description Self-match 1.000 ACN9 homolog ANXA5 0.031 annexin 5 MRPS27 0.026 mitochondrial ribosomal protein S27 BSN 0.026 bassoon protein LYRM2 0.026 LYR motif containing 2 LOC730429 0.017 PREDICTED: similar to ubiquitin protein ligase E3 c... LOC730429 0.017 PREDICTED: similar to ubiquitin protein ligase E3 c... LOC100287219 0.017 PREDICTED: hypothetical protein XP_002342512, parti... MED8 0.017 mediator complex subunit 8 isoform 3 UBR5 0.017 ubiquitin protein ligase E3 component n-recognin 5 [... MED8 0.017 mediator complex subunit 8 isoform 1 ANKRD17 0.013 ankyrin repeat domain protein 17 isoform a LOC100289661 0.009 PREDICTED: hypothetical protein LOC100289661 0.009 PREDICTED: hypothetical protein XP_002343723 SLC39A14 0.009 solute carrier family 39 (zinc transporter), member... SLC39A14 0.009 solute carrier family 39 (zinc transporter), member... SLC39A14 0.009 solute carrier family 39 (zinc transporter), member... SLC39A14 0.009 solute carrier family 39 (zinc transporter), member... TMF1 0.009 TATA element modulatory factor 1 AXIN2 0.009 axin 2 RNF40 0.009 ring finger protein 40 HSCB 0.004 J-type co-chaperone HSC20 JMJD7-PLA2G4B 0.004 JMJD7-PLA2G4B protein ADCY9 0.004 adenylate cyclase 9 MESP2 0.004 mesoderm posterior 2 homolog DNAI1 0.004 dynein, axonemal, intermediate chain 1 PLA2G4B 0.004 phospholipase A2, group IVB RNF14 0.004 ring finger protein 14 isoform 1 RNF14 0.004 ring finger protein 14 isoform 1 RNF14 0.004 ring finger protein 14 isoform 1Human BLASTP results (used to prepare the table) | |||
Gene descriptions are from NCBI RefSeq. Search results were obtained with NCBI BLAST and RefSeq entries. When identical proteins are present, the self-match may not be listed first in BLASTP output. In such cases, the table above has been reordered to place it first.
See About the Figures for the scoring system used in the figure above right. The same scoring system was used in the table of BLASTP results.
Guide to the Human Genome
Copyright © 2010 by Stewart Scherer. All rights reserved.
