
| Name: MESP2 | Sequence: fasta or formatted (397aa) | NCBI GI: 90403598 | |
|
Description: mesoderm posterior 2 homolog
|
Referenced in: Helix-Loop-Helix Transcription Factors
| ||
|
Composition:
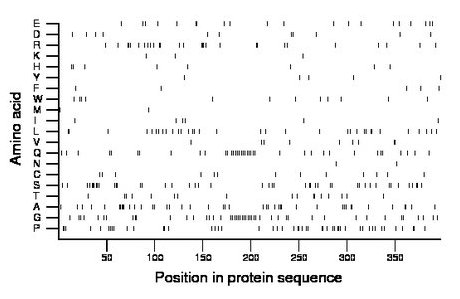
Amino acid Percentage Count Longest homopolymer A alanine 10.8 43 3 C cysteine 3.3 13 1 D aspartate 2.8 11 1 E glutamate 5.0 20 2 F phenylalanine 1.3 5 1 G glycine 11.8 47 2 H histidine 2.0 8 1 I isoleucine 1.5 6 1 K lysine 0.8 3 1 L leucine 8.6 34 2 M methionine 0.5 2 1 N asparagine 0.5 2 1 P proline 12.3 49 3 Q glutamine 9.6 38 1 R arginine 7.1 28 3 S serine 11.3 45 3 T threonine 4.3 17 2 V valine 2.3 9 2 W tryptophan 3.0 12 1 Y tyrosine 1.3 5 1 |
Comparative genomics:
Search single species RefSeq proteins at NCBI
Search summary 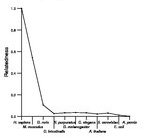
Figure data | ||
Related human proteins:Protein Relative score Description Self-match 1.000 mesoderm posterior 2 homolog MESP1 0.249 mesoderm posterior 1 MSGN1 0.066 mesogenin 1 BHLHA9 0.042 PREDICTED: basic helix-loop-helix family, member a9... BHLHA9 0.042 PREDICTED: basic helix-loop-helix family, member a9... NEUROG3 0.040 neurogenin 3 BHLHA9 0.038 PREDICTED: basic helix-loop-helix family, member a9... PTF1A 0.038 pancreas specific transcription factor, 1a BHLHA15 0.037 basic helix-loop-helix family, member a15 TAF4 0.036 TBP-associated factor 4 TCF15 0.036 basic helix-loop-helix transcription factor 15 [Homo... SCXB 0.033 scleraxis homolog B SCXA 0.033 scleraxis homolog A HAND1 0.033 basic helix-loop-helix transcription factor HAND1 [Ho... TCERG1 0.032 transcription elongation regulator 1 isoform 2 [Homo... TCERG1 0.032 transcription elongation regulator 1 isoform 1 [Homo... LOC100129654 0.031 PREDICTED: similar to transcription factor 23 [Homo... LOC100129654 0.031 PREDICTED: similar to transcription factor 23 [Homo... NHLH1 0.031 nescient helix loop helix 1 LOC100129654 0.029 PREDICTED: similar to transcription factor 23 [Homo... TCF21 0.029 transcription factor 21 TCF21 0.029 transcription factor 21 NEUROG2 0.029 neurogenin 2 NEUROG1 0.029 neurogenin 1 MYF6 0.028 myogenic factor 6 MSC 0.028 musculin LOC100133305 0.027 PREDICTED: hypothetical protein LOC100133305 0.027 PREDICTED: hypothetical protein NHLH2 0.027 nescient helix loop helix 2 NHLH2 0.027 nescient helix loop helix 2Human BLASTP results (used to prepare the table) | |||
Gene descriptions are from NCBI RefSeq. Search results were obtained with NCBI BLAST and RefSeq entries. When identical proteins are present, the self-match may not be listed first in BLASTP output. In such cases, the table above has been reordered to place it first.
See About the Figures for the scoring system used in the figure above right. The same scoring system was used in the table of BLASTP results.
Guide to the Human Genome
Copyright © 2010 by Stewart Scherer. All rights reserved.
