
| Name: TOB2 | Sequence: fasta or formatted (344aa) | NCBI GI: 7706739 | |
|
Description: transducer of ERBB2, 2
|
Referenced in: Additional Cell Cycle Functions
| ||
|
Composition:
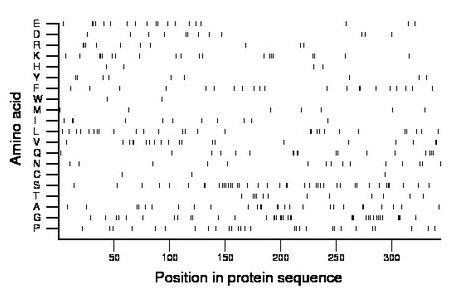
Amino acid Percentage Count Longest homopolymer A alanine 7.8 27 2 C cysteine 0.9 3 1 D aspartate 3.5 12 2 E glutamate 5.5 19 2 F phenylalanine 6.1 21 2 G glycine 10.8 37 3 H histidine 1.2 4 1 I isoleucine 3.2 11 2 K lysine 5.8 20 3 L leucine 8.1 28 2 M methionine 2.0 7 1 N asparagine 4.4 15 1 P proline 8.1 28 2 Q glutamine 5.2 18 2 R arginine 2.9 10 3 S serine 11.9 41 3 T threonine 3.5 12 2 V valine 5.8 20 2 W tryptophan 0.6 2 1 Y tyrosine 2.6 9 1 |
Comparative genomics:
Search single species RefSeq proteins at NCBI
Search summary 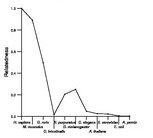
Figure data | ||
Related human proteins:Protein Relative score Description Self-match 1.000 transducer of ERBB2, 2 TOB1 0.506 transducer of ERBB2, 1 BTG1 0.127 B-cell translocation protein 1 BTG2 0.115 B-cell translocation gene 2 BTG3 0.087 B-cell translocation gene 3 isoform b BTG3 0.075 B-cell translocation gene 3 isoform a BTG4 0.069 B-cell translocation gene 4 POM121 0.025 nuclear pore membrane protein 121 DACH1 0.021 dachshund homolog 1 isoform b DACH1 0.021 dachshund homolog 1 isoform a DACH1 0.021 dachshund homolog 1 isoform c SP7 0.021 osterix LOC100288540 0.019 PREDICTED: hypothetical protein XP_002342775 CNOT3 0.018 CCR4-NOT transcription complex, subunit 3 POM121C 0.018 POM121 membrane glycoprotein (rat)-like EVX2 0.018 even-skipped homeobox 2 ZBTB10 0.018 zinc finger and BTB domain containing 10 isoform b ... ZBTB10 0.018 zinc finger and BTB domain containing 10 isoform a ... MN1 0.015 meningioma 1 EN1 0.013 engrailed homeobox 1 MEF2C 0.013 myocyte enhancer factor 2C isoform 2 HR 0.013 hairless protein isoform a HR 0.013 hairless protein isoform b IRS2 0.013 insulin receptor substrate 2 SP8 0.013 Sp8 transcription factor isoform 1 SP8 0.013 Sp8 transcription factor isoform 2 TRO 0.013 trophinin isoform 5 ZIC2 0.013 zinc finger protein of the cerebellum 2 LOR 0.013 loricrin BHLHE22 0.013 basic helix-loop-helix domain containing, class B, 5...Human BLASTP results (used to prepare the table) | |||
Gene descriptions are from NCBI RefSeq. Search results were obtained with NCBI BLAST and RefSeq entries. When identical proteins are present, the self-match may not be listed first in BLASTP output. In such cases, the table above has been reordered to place it first.
See About the Figures for the scoring system used in the figure above right. The same scoring system was used in the table of BLASTP results.
Guide to the Human Genome
Copyright © 2010 by Stewart Scherer. All rights reserved.
