
| Name: BTG3 | Sequence: fasta or formatted (296aa) | NCBI GI: 195963406 | |
|
Description: B-cell translocation gene 3 isoform a
|
Referenced in: Additional Cell Cycle Functions
| ||
Other entries for this name:
alt prot [252aa] B-cell translocation gene 3 isoform b | |||
|
Composition:
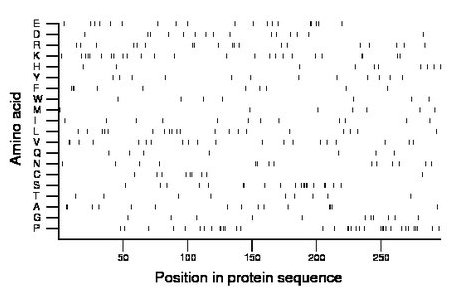
Amino acid Percentage Count Longest homopolymer A alanine 5.1 15 3 C cysteine 3.0 9 2 D aspartate 5.1 15 1 E glutamate 6.4 19 2 F phenylalanine 3.4 10 3 G glycine 3.7 11 1 H histidine 3.4 10 1 I isoleucine 4.1 12 1 K lysine 8.4 25 2 L leucine 6.8 20 1 M methionine 2.4 7 1 N asparagine 4.7 14 2 P proline 11.8 35 3 Q glutamine 2.4 7 1 R arginine 6.4 19 2 S serine 6.8 20 4 T threonine 3.0 9 1 V valine 6.8 20 2 W tryptophan 2.4 7 1 Y tyrosine 4.1 12 1 |
Comparative genomics:
Search single species RefSeq proteins at NCBI
Search summary 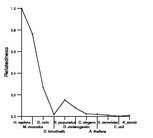
Figure data | ||
Related human proteins:Protein Relative score Description Self-match 1.000 B-cell translocation gene 3 isoform a BTG3 0.808 B-cell translocation gene 3 isoform b BTG4 0.232 B-cell translocation gene 4 BTG1 0.100 B-cell translocation protein 1 BTG2 0.096 B-cell translocation gene 2 TOB1 0.083 transducer of ERBB2, 1 TOB2 0.082 transducer of ERBB2, 2 MAMLD1 0.028 mastermind-like domain containing 1 PHACTR2 0.016 phosphatase and actin regulator 2 isoform 3 PHACTR2 0.016 phosphatase and actin regulator 2 isoform 1 MYO15A 0.016 myosin XV GAB1 0.016 GRB2-associated binding protein 1 isoform b GAB1 0.016 GRB2-associated binding protein 1 isoform a SETD1A 0.016 SET domain containing 1A LOC100292251 0.015 PREDICTED: similar to Tripartite motif-containing p... LOC100290015 0.015 PREDICTED: hypothetical protein XP_002348292 ANK2 0.015 ankyrin 2 isoform 1 CCNK 0.013 cyclin K isoform 1 PTCH1 0.013 patched isoform S PTCH1 0.013 patched isoform S PTCH1 0.013 patched isoform S PTCH1 0.013 patched isoform S PTCH1 0.013 patched isoform L' PTCH1 0.013 patched isoform M PTCH1 0.013 patched isoform L PRDM2 0.011 retinoblastoma protein-binding zinc finger protein i... PRDM2 0.011 retinoblastoma protein-binding zinc finger protein i... SETD1B 0.011 SET domain containing 1B MLL 0.011 myeloid/lymphoid or mixed-lineage leukemia protein [... PLSCR4 0.011 phospholipid scramblase 4 isoform bHuman BLASTP results (used to prepare the table) | |||
Gene descriptions are from NCBI RefSeq. Search results were obtained with NCBI BLAST and RefSeq entries. When identical proteins are present, the self-match may not be listed first in BLASTP output. In such cases, the table above has been reordered to place it first.
See About the Figures for the scoring system used in the figure above right. The same scoring system was used in the table of BLASTP results.
Guide to the Human Genome
Copyright © 2010 by Stewart Scherer. All rights reserved.
