
| Name: SAE1 | Sequence: fasta or formatted (346aa) | NCBI GI: 7705473 | |
|
Description: SUMO1 activating enzyme subunit 1 isoform a
|
Referenced in: Ubiquitin and Related Protein Modifications
| ||
Other entries for this name:
alt prot [299aa] SUMO1 activating enzyme subunit 1 isoform b alt prot [266aa] SUMO1 activating enzyme subunit 1 isoform c alt prot [346aa] SUMO1 activating enzyme subunit 1 isoform a | |||
|
Composition:
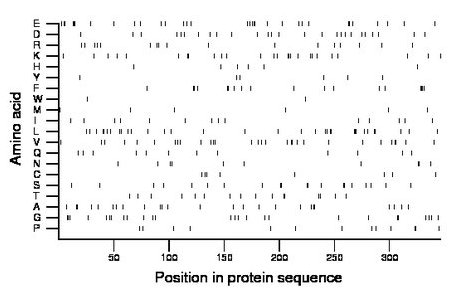
Amino acid Percentage Count Longest homopolymer A alanine 7.2 25 2 C cysteine 2.3 8 2 D aspartate 7.5 26 1 E glutamate 9.2 32 3 F phenylalanine 5.2 18 4 G glycine 7.5 26 3 H histidine 1.7 6 1 I isoleucine 4.0 14 1 K lysine 7.5 26 3 L leucine 9.5 33 3 M methionine 1.7 6 1 N asparagine 2.9 10 2 P proline 3.8 13 2 Q glutamine 3.5 12 1 R arginine 4.9 17 1 S serine 5.8 20 2 T threonine 4.6 16 2 V valine 8.7 30 2 W tryptophan 0.6 2 1 Y tyrosine 1.7 6 1 |
Comparative genomics:
Search single species RefSeq proteins at NCBI
Search summary 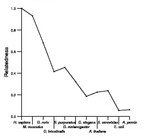
Figure data | ||
Related human proteins:Protein Relative score Description Self-match 1.000 SUMO1 activating enzyme subunit 1 isoform a SAE1 0.987 SUMO1 activating enzyme subunit 1 isoform a SAE1 0.678 SUMO1 activating enzyme subunit 1 isoform c SAE1 0.678 SUMO1 activating enzyme subunit 1 isoform b UBA1 0.147 ubiquitin-activating enzyme E1 UBA1 0.147 ubiquitin-activating enzyme E1 UBA7 0.129 ubiquitin-like modifier activating enzyme 7 NAE1 0.115 NEDD8 activating enzyme E1 subunit 1 isoform a NAE1 0.102 NEDD8 activating enzyme E1 subunit 1 isoform b [Homo... UBA6 0.090 ubiquitin-activating enzyme E1-like 2 UBA2 0.049 SUMO-1 activating enzyme subunit 2 UBA3 0.046 ubiquitin-activating enzyme 3 isoform 2 UBA3 0.046 ubiquitin-activating enzyme 3 isoform 1 MOCS3 0.034 molybdenum cofactor synthesis 3 NAE1 0.033 NEDD8 activating enzyme E1 subunit 1 isoform c [Homo... ATG7 0.018 APG7 autophagy 7-like isoform c ATG7 0.018 APG7 autophagy 7-like isoform b ATG7 0.018 APG7 autophagy 7-like isoform a UBA5 0.015 ubiquitin-activating enzyme 5 isoform 2 UBA5 0.015 ubiquitin-activating enzyme 5 isoform 1 LOC100131897 0.007 hypothetical protein LOC100131897 DOCK6 0.006 dedicator of cytokinesis 6 DOCK7 0.006 dedicator of cytokinesis 7 ABHD6 0.004 abhydrolase domain containing 6 COL22A1 0.004 collagen, type XXII, alpha 1Human BLASTP results (used to prepare the table) | |||
Gene descriptions are from NCBI RefSeq. Search results were obtained with NCBI BLAST and RefSeq entries. When identical proteins are present, the self-match may not be listed first in BLASTP output. In such cases, the table above has been reordered to place it first.
See About the Figures for the scoring system used in the figure above right. The same scoring system was used in the table of BLASTP results.
Guide to the Human Genome
Copyright © 2010 by Stewart Scherer. All rights reserved.
