
| Name: RAB11FIP2 | Sequence: fasta or formatted (512aa) | NCBI GI: 7662394 | |
|
Description: RAB11 family interacting protein 2 (class I)
|
Referenced in:
| ||
|
Composition:
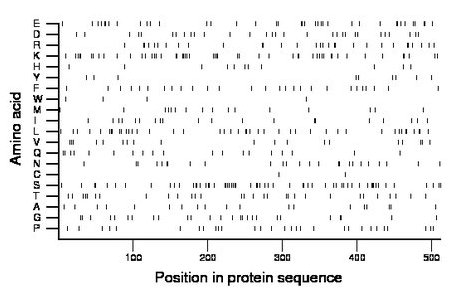
Amino acid Percentage Count Longest homopolymer A alanine 3.7 19 1 C cysteine 0.4 2 1 D aspartate 5.9 30 1 E glutamate 7.4 38 2 F phenylalanine 5.3 27 1 G glycine 5.1 26 2 H histidine 2.1 11 1 I isoleucine 4.3 22 2 K lysine 10.0 51 2 L leucine 8.6 44 2 M methionine 3.3 17 2 N asparagine 4.9 25 2 P proline 5.7 29 1 Q glutamine 3.7 19 1 R arginine 5.9 30 2 S serine 11.7 60 3 T threonine 5.9 30 1 V valine 3.7 19 1 W tryptophan 0.8 4 1 Y tyrosine 1.8 9 1 |
Comparative genomics:
Search single species RefSeq proteins at NCBI
Search summary 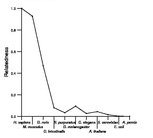
Figure data | ||
Related human proteins:Protein Relative score Description Self-match 1.000 RAB11 family interacting protein 2 (class I) RAB11FIP1 0.228 RAB11 family interacting protein 1 isoform 3 RAB11FIP1 0.228 RAB11 family interacting protein 1 isoform 1 RAB11FIP5 0.173 RAB11 family interacting protein 5 (class I) RAB11FIP1 0.059 RAB11 family interacting protein 1 isoform 2 LOC100132214 0.031 PREDICTED: similar to calcium-promoted Ras inactiva... LOC100132214 0.031 PREDICTED: similar to calcium-promoted Ras inactiva... LOC100132214 0.031 PREDICTED: similar to calcium-promoted Ras inactiva... LOC100132214 0.031 PREDICTED: similar to calcium-promoted Ras inactiva... RASA4 0.031 RAS p21 protein activator 4 isoform 2 RASA4 0.031 RAS p21 protein activator 4 isoform 1 MCTP1 0.027 multiple C2 domains, transmembrane 1 isoform S [Homo... MCTP1 0.027 multiple C2 domains, transmembrane 1 isoform L [Hom... UNC13C 0.026 unc-13 homolog C UNC13A 0.026 unc-13 homolog A SYTL2 0.025 synaptotagmin-like 2 isoform b SYTL2 0.025 synaptotagmin-like 2 isoform a SYTL2 0.025 synaptotagmin-like 2 isoform i SYTL2 0.025 synaptotagmin-like 2 isoform h SYTL2 0.025 synaptotagmin-like 2 isoform g SYTL2 0.025 synaptotagmin-like 2 isoform f SYTL2 0.025 synaptotagmin-like 2 isoform e SYTL2 0.025 synaptotagmin-like 2 isoform d SYTL2 0.025 synaptotagmin-like 2 isoform c UNC13B 0.025 UNC13 (C. elegans)-like RASAL1 0.024 RAS protein activator like 1 SYT1 0.024 synaptotagmin I SYT1 0.024 synaptotagmin I SYT1 0.024 synaptotagmin I SYT2 0.023 synaptotagmin IIHuman BLASTP results (used to prepare the table) | |||
Gene descriptions are from NCBI RefSeq. Search results were obtained with NCBI BLAST and RefSeq entries. When identical proteins are present, the self-match may not be listed first in BLASTP output. In such cases, the table above has been reordered to place it first.
See About the Figures for the scoring system used in the figure above right. The same scoring system was used in the table of BLASTP results.
Guide to the Human Genome
Copyright © 2010 by Stewart Scherer. All rights reserved.
