
| Name: SYTL2 | Sequence: fasta or formatted (365aa) | NCBI GI: 46255068 | |
|
Description: synaptotagmin-like 2 isoform f
|
Referenced in: ER, Golgi, and the Secretory Pathway
| ||
Other entries for this name:
alt prot [376aa] synaptotagmin-like 2 isoform b alt prot [910aa] synaptotagmin-like 2 isoform a alt prot [934aa] synaptotagmin-like 2 isoform g alt prot [336aa] synaptotagmin-like 2 isoform h alt prot [935aa] synaptotagmin-like 2 isoform i alt prot [1272aa] synaptotagmin-like 2 isoform c alt prot [1256aa] synaptotagmin-like 2 isoform d alt prot [376aa] synaptotagmin-like 2 isoform e | |||
|
Composition:
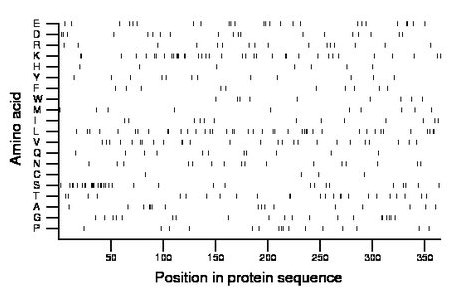
Amino acid Percentage Count Longest homopolymer A alanine 4.4 16 3 C cysteine 1.1 4 1 D aspartate 5.2 19 2 E glutamate 6.8 25 2 F phenylalanine 2.7 10 1 G glycine 5.5 20 2 H histidine 1.9 7 1 I isoleucine 3.6 13 1 K lysine 10.1 37 3 L leucine 11.2 41 2 M methionine 2.7 10 1 N asparagine 4.4 16 1 P proline 4.4 16 1 Q glutamine 3.0 11 1 R arginine 4.4 16 1 S serine 8.8 32 4 T threonine 6.8 25 2 V valine 7.1 26 2 W tryptophan 2.5 9 1 Y tyrosine 3.3 12 1 |
Comparative genomics:
Search single species RefSeq proteins at NCBI
Search summary 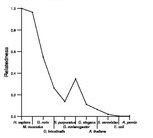
Figure data | ||
Related human proteins:Protein Relative score Description Self-match 1.000 synaptotagmin-like 2 isoform f SYTL2 0.999 synaptotagmin-like 2 isoform b SYTL2 0.999 synaptotagmin-like 2 isoform i SYTL2 0.999 synaptotagmin-like 2 isoform g SYTL2 0.999 synaptotagmin-like 2 isoform e SYTL2 0.999 synaptotagmin-like 2 isoform d SYTL2 0.999 synaptotagmin-like 2 isoform c SYTL2 0.899 synaptotagmin-like 2 isoform a SYTL2 0.895 synaptotagmin-like 2 isoform h SYTL1 0.424 synaptotagmin-like 1 SYTL4 0.370 synaptotagmin-like 4 SYTL4 0.370 synaptotagmin-like 4 SYTL5 0.321 synaptotagmin-like 5 isoform 1 SYTL5 0.321 synaptotagmin-like 5 isoform 1 SYTL5 0.318 synaptotagmin-like 5 isoform 2 SYTL3 0.238 synaptotagmin-like 3 SYT3 0.122 synaptotagmin III SYT3 0.122 synaptotagmin III SYT3 0.122 synaptotagmin III SYT6 0.120 synaptotagmin VI SYT2 0.119 synaptotagmin II SYT2 0.119 synaptotagmin II RPH3A 0.115 rabphilin 3A homolog isoform 1 RPH3A 0.115 rabphilin 3A homolog isoform 2 SYT10 0.115 synaptotagmin X DOC2B 0.115 double C2-like domains, beta SYT1 0.108 synaptotagmin I SYT1 0.108 synaptotagmin I SYT1 0.108 synaptotagmin I SYT9 0.106 synaptotagmin IXHuman BLASTP results (used to prepare the table) | |||
Gene descriptions are from NCBI RefSeq. Search results were obtained with NCBI BLAST and RefSeq entries. When identical proteins are present, the self-match may not be listed first in BLASTP output. In such cases, the table above has been reordered to place it first.
See About the Figures for the scoring system used in the figure above right. The same scoring system was used in the table of BLASTP results.
Guide to the Human Genome
Copyright © 2010 by Stewart Scherer. All rights reserved.
