
| Name: MAML1 | Sequence: fasta or formatted (1016aa) | NCBI GI: 7661990 | |
|
Description: mastermind-like 1
|
Referenced in:
| ||
|
Composition:
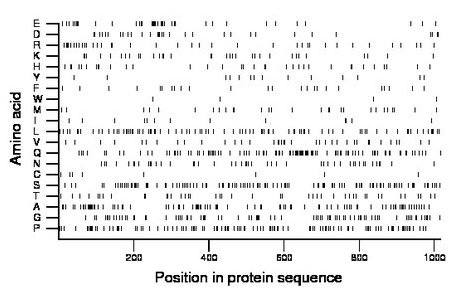
Amino acid Percentage Count Longest homopolymer A alanine 9.1 92 3 C cysteine 0.8 8 1 D aspartate 3.1 32 2 E glutamate 3.8 39 2 F phenylalanine 2.4 24 1 G glycine 8.1 82 2 H histidine 3.3 34 2 I isoleucine 1.4 14 1 K lysine 3.5 36 2 L leucine 8.9 90 3 M methionine 2.9 29 2 N asparagine 4.7 48 2 P proline 11.1 113 3 Q glutamine 10.9 111 4 R arginine 3.8 39 3 S serine 12.3 125 2 T threonine 4.2 43 1 V valine 3.8 39 2 W tryptophan 0.4 4 1 Y tyrosine 1.4 14 1 |
Comparative genomics:
Search single species RefSeq proteins at NCBI
Search summary 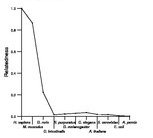
Figure data | ||
Related human proteins:Protein Relative score Description Self-match 1.000 mastermind-like 1 MAML3 0.241 mastermind-like 3 MAML2 0.080 mastermind-like 2 ARID1B 0.023 AT rich interactive domain 1B (SWI1-like) isoform 1 ... ARID1B 0.023 AT rich interactive domain 1B (SWI1-like) isoform 3 ... MLL2 0.023 myeloid/lymphoid or mixed-lineage leukemia 2 CREBBP 0.022 CREB binding protein isoform b CREBBP 0.022 CREB binding protein isoform a NCOA6 0.022 nuclear receptor coactivator 6 ARID1B 0.021 AT rich interactive domain 1B (SWI1-like) isoform 2 ... ARID1A 0.020 AT rich interactive domain 1A isoform a ARID1A 0.020 AT rich interactive domain 1A isoform b MED15 0.017 mediator complex subunit 15 isoform a EP400 0.016 E1A binding protein p400 BCL9 0.016 B-cell CLL/lymphoma 9 AAK1 0.015 AP2 associated kinase 1 MAP7D1 0.015 MAP7 domain containing 1 PCLO 0.015 piccolo isoform 2 PCLO 0.015 piccolo isoform 1 NFAT5 0.015 nuclear factor of activated T-cells 5 isoform a [Hom... NFAT5 0.015 nuclear factor of activated T-cells 5 isoform c [Homo... NFAT5 0.015 nuclear factor of activated T-cells 5 isoform d [Ho... NFAT5 0.015 nuclear factor of activated T-cells 5 isoform b [Ho... NFAT5 0.015 nuclear factor of activated T-cells 5 isoform a [Hom... MN1 0.015 meningioma 1 R3HDM2 0.015 R3H domain containing 2 FOXP2 0.014 forkhead box P2 isoform I FOXP2 0.014 forkhead box P2 isoform II MED12 0.014 mediator complex subunit 12 MED15 0.014 mediator complex subunit 15 isoform bHuman BLASTP results (used to prepare the table) | |||
Gene descriptions are from NCBI RefSeq. Search results were obtained with NCBI BLAST and RefSeq entries. When identical proteins are present, the self-match may not be listed first in BLASTP output. In such cases, the table above has been reordered to place it first.
See About the Figures for the scoring system used in the figure above right. The same scoring system was used in the table of BLASTP results.
Guide to the Human Genome
Copyright © 2010 by Stewart Scherer. All rights reserved.
