
| Name: ABI1 | Sequence: fasta or formatted (452aa) | NCBI GI: 61743946 | |
|
Description: abl-interactor 1 isoform c
|
Referenced in: Non-Receptor Tyrosine Kinase Pathways
| ||
Other entries for this name:
alt prot [508aa] abl-interactor 1 isoform a alt prot [481aa] abl-interactor 1 isoform b alt prot [476aa] abl-interactor 1 isoform d | |||
|
Composition:
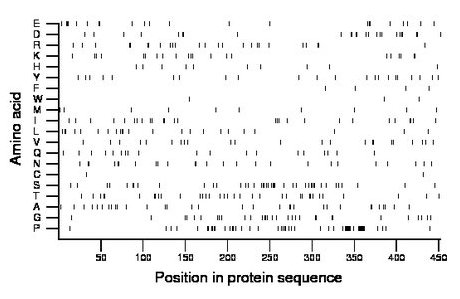
Amino acid Percentage Count Longest homopolymer A alanine 7.1 32 2 C cysteine 0.4 2 1 D aspartate 5.5 25 2 E glutamate 4.9 22 3 F phenylalanine 0.9 4 1 G glycine 6.9 31 2 H histidine 2.2 10 1 I isoleucine 6.0 27 2 K lysine 4.6 21 2 L leucine 5.1 23 2 M methionine 2.2 10 1 N asparagine 5.5 25 2 P proline 11.3 51 8 Q glutamine 4.2 19 1 R arginine 5.5 25 2 S serine 9.3 42 3 T threonine 7.7 35 2 V valine 5.1 23 2 W tryptophan 0.7 3 1 Y tyrosine 4.9 22 1 |
Comparative genomics:
Search single species RefSeq proteins at NCBI
Search summary 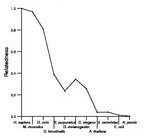
Figure data | ||
Related human proteins:Protein Relative score Description Self-match 1.000 abl-interactor 1 isoform c ABI1 0.982 abl-interactor 1 isoform b ABI1 0.967 abl-interactor 1 isoform a ABI1 0.963 abl-interactor 1 isoform d ABI2 0.691 abl interactor 2 ABI3 0.277 NESH protein isoform 1 ABI3 0.267 NESH protein isoform 2 MYO1E 0.046 myosin IE ITSN2 0.044 intersectin 2 isoform 3 ITSN2 0.044 intersectin 2 isoform 1 ITSN2 0.044 intersectin 2 isoform 2 SORBS2 0.044 sorbin and SH3 domain containing 2 isoform 6 SORBS2 0.044 sorbin and SH3 domain containing 2 isoform 4 ITSN1 0.040 intersectin 1 isoform ITSN-s ITSN1 0.040 intersectin 1 isoform ITSN-l MYO1F 0.039 myosin IF HCLS1 0.038 hematopoietic cell-specific Lyn substrate 1 SETD1A 0.038 SET domain containing 1A SH3RF1 0.038 SH3 domain containing ring finger 1 SORBS2 0.037 sorbin and SH3 domain containing 2 isoform 8 SORBS2 0.037 sorbin and SH3 domain containing 2 isoform 7 SORBS2 0.037 sorbin and SH3 domain containing 2 isoform 5 SORBS2 0.037 sorbin and SH3 domain containing 2 isoform 3 SORBS2 0.037 sorbin and SH3 domain containing 2 isoform 2 SORBS2 0.037 sorbin and SH3 domain containing 2 isoform 1 CTTN 0.037 cortactin isoform a CTTN 0.037 cortactin isoform b SF1 0.035 splicing factor 1 isoform 1 ATN1 0.034 atrophin-1 ATN1 0.034 atrophin-1Human BLASTP results (used to prepare the table) | |||
Gene descriptions are from NCBI RefSeq. Search results were obtained with NCBI BLAST and RefSeq entries. When identical proteins are present, the self-match may not be listed first in BLASTP output. In such cases, the table above has been reordered to place it first.
See About the Figures for the scoring system used in the figure above right. The same scoring system was used in the table of BLASTP results.
Guide to the Human Genome
Copyright © 2010 by Stewart Scherer. All rights reserved.
