
| Name: GPR110 | Sequence: fasta or formatted (218aa) | NCBI GI: 61743938 | |
|
Description: G-protein coupled receptor 110 isoform 2
|
Referenced in:
| ||
Other entries for this name:
alt prot [910aa] G-protein coupled receptor 110 isoform 1 | |||
|
Composition:

Amino acid Percentage Count Longest homopolymer A alanine 3.2 7 1 C cysteine 4.1 9 1 D aspartate 3.7 8 1 E glutamate 5.5 12 2 F phenylalanine 5.0 11 2 G glycine 6.4 14 2 H histidine 2.3 5 1 I isoleucine 6.0 13 2 K lysine 8.7 19 3 L leucine 12.8 28 3 M methionine 0.9 2 1 N asparagine 6.4 14 2 P proline 3.7 8 2 Q glutamine 4.1 9 1 R arginine 4.1 9 1 S serine 7.3 16 3 T threonine 6.4 14 2 V valine 4.1 9 1 W tryptophan 1.8 4 1 Y tyrosine 3.2 7 1 |
Comparative genomics:
Search single species RefSeq proteins at NCBI
Search summary 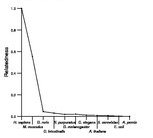
Figure data | ||
Related human proteins:Protein Relative score Description Self-match 1.000 G-protein coupled receptor 110 isoform 2 GPR110 0.937 G-protein coupled receptor 110 isoform 1 GPR116 0.098 G-protein coupled receptor 116 GPR116 0.098 G-protein coupled receptor 116 IMPG1 0.033 interphotoreceptor matrix proteoglycan 1 EFEMP2 0.030 EGF-containing fibulin-like extracellular matrix pr... RHOBTB3 0.016 rho-related BTB domain containing 3 CRB1 0.014 crumbs homolog 1 precursor USH2A 0.012 usherin isoform B USH2A 0.012 usherin isoform A DYNC2H1 0.012 dynein, cytoplasmic 2, heavy chain 1 SCUBE1 0.012 signal peptide, CUB domain, EGF-like 1 STAB1 0.009 stabilin 1 precursor SCUBE3 0.009 signal peptide, CUB domain, EGF-like 3 EGF 0.009 epidermal growth factor (beta-urogastrone) FBN2 0.009 fibrillin 2 precursor CELSR1 0.009 cadherin EGF LAG seven-pass G-type receptor 1 LTBP1 0.007 latent transforming growth factor beta binding prote... LTBP1 0.007 latent transforming growth factor beta binding prote... KRT36 0.007 keratin 36 UMOD 0.007 uromodulin precursor UMOD 0.007 uromodulin precursor PENK 0.007 proenkephalin PENK 0.007 proenkephalin DNAH14 0.007 dynein, axonemal, heavy polypeptide 14 isoform 1 [H... SCUBE2 0.007 CEGP1 proteinHuman BLASTP results (used to prepare the table) | |||
Gene descriptions are from NCBI RefSeq. Search results were obtained with NCBI BLAST and RefSeq entries. When identical proteins are present, the self-match may not be listed first in BLASTP output. In such cases, the table above has been reordered to place it first.
See About the Figures for the scoring system used in the figure above right. The same scoring system was used in the table of BLASTP results.
Guide to the Human Genome
Copyright © 2010 by Stewart Scherer. All rights reserved.
