
| Name: ARHGAP29 | Sequence: fasta or formatted (1261aa) | NCBI GI: 134304853 | |
|
Description: PTPL1-associated RhoGAP 1
|
Referenced in:
| ||
|
Composition:
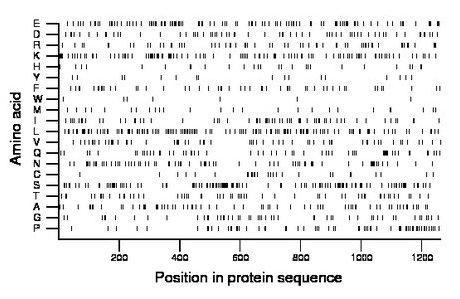
Amino acid Percentage Count Longest homopolymer A alanine 5.7 72 2 C cysteine 2.1 27 1 D aspartate 5.0 63 2 E glutamate 9.0 114 3 F phenylalanine 4.0 51 2 G glycine 4.0 51 2 H histidine 2.1 27 1 I isoleucine 4.9 62 2 K lysine 8.4 106 3 L leucine 10.6 134 3 M methionine 2.1 27 1 N asparagine 5.6 71 2 P proline 5.1 64 2 Q glutamine 4.8 60 2 R arginine 4.8 61 2 S serine 9.7 122 3 T threonine 4.9 62 2 V valine 5.0 63 2 W tryptophan 0.6 7 1 Y tyrosine 1.3 17 1 |
Comparative genomics:
Search single species RefSeq proteins at NCBI
Search summary 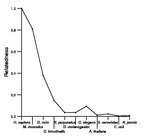
Figure data | ||
Related human proteins:Protein Relative score Description Self-match 1.000 PTPL1-associated RhoGAP 1 HMHA1 0.228 minor histocompatibility antigen HA-1 GMIP 0.183 GEM interacting protein CHN2 0.038 beta chimerin isoform 2 CHN2 0.038 beta chimerin isoform 1 CHN1 0.036 chimerin (chimaerin) 1 isoform a CHN1 0.036 chimerin (chimaerin) 1 isoform b ARHGAP12 0.034 Rho GTPase activating protein 12 ARHGAP27 0.032 Rho GTPase activating protein 27 isoform b ARHGAP27 0.032 Rho GTPase activating protein 27 isoform a MYO9A 0.032 myosin IXA MYO9B 0.030 myosin IXB isoform 1 ARHGAP15 0.030 ARHGAP15 MYO9B 0.029 myosin IXB isoform 2 ABR 0.029 active breakpoint cluster region-related protein i... ABR 0.029 active breakpoint cluster region-related protein is... ABR 0.029 active breakpoint cluster region-related protein is... ARHGAP21 0.029 Rho GTPase activating protein 21 ARHGAP23 0.028 Rho GTPase activating protein 23 ARHGAP10 0.028 Rho GTPase activating protein 10 RACGAP1 0.028 Rac GTPase activating protein 1 RACGAP1 0.028 Rac GTPase activating protein 1 RACGAP1 0.028 Rac GTPase activating protein 1 ARHGAP9 0.028 Rho GTPase activating protein 9 isoform 1 ARHGAP9 0.028 Rho GTPase activating protein 9 isoform 3 ARHGAP30 0.027 Rho GTPase activating protein 30 isoform 2 ARHGAP30 0.027 Rho GTPase activating protein 30 isoform 1 CDGAP 0.027 Cdc42 GTPase-activating protein OPHN1 0.027 oligophrenin 1 BCR 0.027 breakpoint cluster region isoform 2Human BLASTP results (used to prepare the table) | |||
Gene descriptions are from NCBI RefSeq. Search results were obtained with NCBI BLAST and RefSeq entries. When identical proteins are present, the self-match may not be listed first in BLASTP output. In such cases, the table above has been reordered to place it first.
See About the Figures for the scoring system used in the figure above right. The same scoring system was used in the table of BLASTP results.
Guide to the Human Genome
Copyright © 2010 by Stewart Scherer. All rights reserved.
