
| Name: LMOD3 | Sequence: fasta or formatted (560aa) | NCBI GI: 54607116 | |
|
Description: leiomodin 3 (fetal)
|
Referenced in:
| ||
|
Composition:
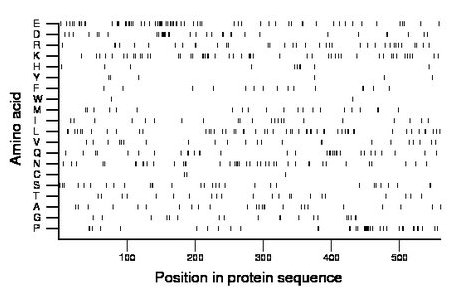
Amino acid Percentage Count Longest homopolymer A alanine 4.5 25 1 C cysteine 0.5 3 1 D aspartate 6.1 34 6 E glutamate 12.7 71 4 F phenylalanine 2.7 15 2 G glycine 3.4 19 2 H histidine 1.8 10 2 I isoleucine 3.9 22 1 K lysine 9.3 52 2 L leucine 9.3 52 2 M methionine 3.9 22 2 N asparagine 7.3 41 2 P proline 7.0 39 4 Q glutamine 5.9 33 3 R arginine 6.6 37 2 S serine 5.4 30 2 T threonine 4.1 23 2 V valine 4.3 24 2 W tryptophan 0.4 2 1 Y tyrosine 1.1 6 1 |
Comparative genomics:
Search single species RefSeq proteins at NCBI
Search summary 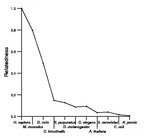
Figure data | ||
Related human proteins:Protein Relative score Description Self-match 1.000 leiomodin 3 (fetal) LMOD2 0.284 leiomodin 2 (cardiac) LMOD1 0.231 leiomodin 1 (smooth muscle) TMOD2 0.158 neuronal tropomodulin isoform a TMOD4 0.143 tropomodulin 4 (muscle) TMOD1 0.123 tropomodulin 1 TMOD3 0.122 tropomodulin 3 (ubiquitous) TMOD2 0.116 neuronal tropomodulin isoform b YTHDC1 0.036 splicing factor YT521-B isoform 2 MYT1 0.033 myelin transcription factor 1 YTHDC1 0.031 splicing factor YT521-B isoform 1 CCDC136 0.030 coiled-coil domain containing 136 UBTF 0.028 upstream binding transcription factor, RNA polymera... UBTF 0.028 upstream binding transcription factor, RNA polymera... UBTF 0.028 upstream binding transcription factor, RNA polymerase... WDR87 0.026 NYD-SP11 protein MYT1L 0.026 myelin transcription factor 1-like MAP7D2 0.026 MAP7 domain containing 2 ITSN2 0.026 intersectin 2 isoform 3 ARID4B 0.026 AT rich interactive domain 4B isoform 1 ATRX 0.026 transcriptional regulator ATRX isoform 2 ATRX 0.026 transcriptional regulator ATRX isoform 1 LOC100133758 0.026 PREDICTED: hypothetical protein, partial LOC645202 0.026 PREDICTED: hypothetical protein LOC645202 LOC283685 0.025 PREDICTED: golgi autoantigen, golgin subfamily a-li... NCL 0.025 nucleolin PSIP1 0.025 PC4 and SFRS1 interacting protein 1 isoform 2 [Homo... PSIP1 0.025 PC4 and SFRS1 interacting protein 1 isoform 2 MYST4 0.025 MYST histone acetyltransferase (monocytic leukemia)... LOC283685 0.025 PREDICTED: golgi autoantigen, golgin subfamily a-li...Human BLASTP results (used to prepare the table) | |||
Gene descriptions are from NCBI RefSeq. Search results were obtained with NCBI BLAST and RefSeq entries. When identical proteins are present, the self-match may not be listed first in BLASTP output. In such cases, the table above has been reordered to place it first.
See About the Figures for the scoring system used in the figure above right. The same scoring system was used in the table of BLASTP results.
Guide to the Human Genome
Copyright © 2010 by Stewart Scherer. All rights reserved.
