
| Name: NKG7 | Sequence: fasta or formatted (165aa) | NCBI GI: 5031949 | |
|
Description: natural killer cell group 7 sequence
| Not currently referenced in the text | ||
|
Composition:
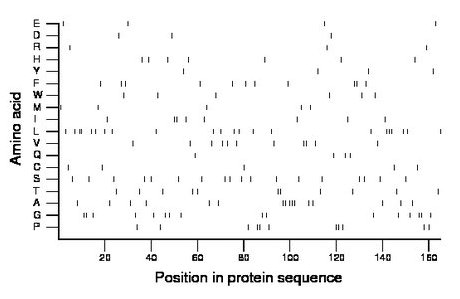
Amino acid Percentage Count Longest homopolymer A alanine 9.7 16 3 C cysteine 3.0 5 1 D aspartate 1.8 3 1 E glutamate 2.4 4 1 F phenylalanine 6.7 11 2 G glycine 9.7 16 2 H histidine 4.2 7 1 I isoleucine 4.8 8 2 K lysine 0.0 0 0 L leucine 13.3 22 3 M methionine 3.0 5 1 N asparagine 0.0 0 0 P proline 6.7 11 2 Q glutamine 2.4 4 1 R arginine 1.8 3 1 S serine 10.9 18 1 T threonine 6.7 11 2 V valine 6.7 11 2 W tryptophan 3.6 6 1 Y tyrosine 2.4 4 1 |
Comparative genomics:
Search single species RefSeq proteins at NCBI
Search summary 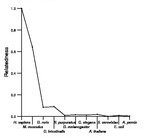
Figure data | ||
Related human proteins:Protein Relative score Description Self-match 1.000 natural killer cell group 7 sequence LIM2 0.081 lens intrinsic membrane protein 2, 19kDa isoform 2 ... LIM2 0.044 lens intrinsic membrane protein 2, 19kDa isoform 1 [... TMEM114 0.031 PREDICTED: transmembrane protein 114 TMEM114 0.031 transmembrane protein 114 PERP 0.028 PERP, TP53 apoptosis effector TMEM114 0.028 PREDICTED: transmembrane protein 114, partial [Homo... CLDND2 0.028 claudin domain containing 2 CACNG2 0.025 voltage-dependent calcium channel gamma-2 subunit [Ho... CLDN11 0.025 claudin 11 TMEM114 0.025 PREDICTED: transmembrane protein 114 CACNG6 0.022 voltage-dependent calcium channel gamma-6 subunit is... CACNG3 0.022 voltage-dependent calcium channel gamma-3 subunit [Ho... CACNG6 0.016 voltage-dependent calcium channel gamma-6 subunit is... CACNG8 0.016 voltage-dependent calcium channel gamma-8 subunit [H... LGR6 0.012 leucine-rich repeat-containing G protein-coupled rec... LGR6 0.012 leucine-rich repeat-containing G protein-coupled rec... LGR6 0.012 leucine-rich repeat-containing G protein-coupled rec... CACNG4 0.012 voltage-dependent calcium channel gamma-4 subunit [Ho... TMEM202 0.012 transmembrane protein 202 CLDN15 0.009 claudin 15 CACNG7 0.009 voltage-dependent calcium channel gamma-7 subunit [H... CACNG6 0.009 voltage-dependent calcium channel gamma-6 subunit is... TMEM106A 0.009 transmembrane protein 106A NANOS1 0.006 nanos homolog 1 CACNG1 0.006 voltage-dependent calcium channel gamma-1 subunit [Ho... GPR114 0.006 G protein-coupled receptor 114Human BLASTP results (used to prepare the table) | |||
Gene descriptions are from NCBI RefSeq. Search results were obtained with NCBI BLAST and RefSeq entries. When identical proteins are present, the self-match may not be listed first in BLASTP output. In such cases, the table above has been reordered to place it first.
See About the Figures for the scoring system used in the figure above right. The same scoring system was used in the table of BLASTP results.
Guide to the Human Genome
Copyright © 2010 by Stewart Scherer. All rights reserved.
