
| Name: RAB40C | Sequence: fasta or formatted (281aa) | NCBI GI: 46195789 | |
|
Description: RAB40C, member RAS oncogene family
|
Referenced in:
| ||
|
Composition:
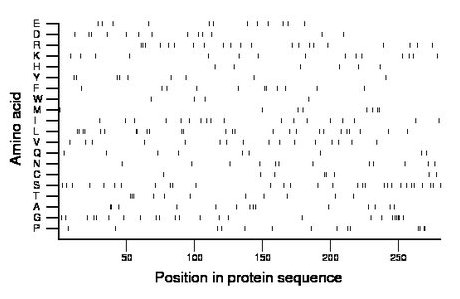
Amino acid Percentage Count Longest homopolymer A alanine 5.0 14 2 C cysteine 2.8 8 2 D aspartate 4.6 13 1 E glutamate 4.3 12 1 F phenylalanine 3.9 11 2 G glycine 8.5 24 4 H histidine 2.1 6 1 I isoleucine 6.4 18 1 K lysine 5.3 15 1 L leucine 9.3 26 2 M methionine 2.8 8 2 N asparagine 4.3 12 1 P proline 5.0 14 2 Q glutamine 3.2 9 1 R arginine 7.5 21 2 S serine 10.7 30 1 T threonine 3.9 11 3 V valine 5.7 16 1 W tryptophan 1.4 4 1 Y tyrosine 3.2 9 1 |
Comparative genomics:
Search single species RefSeq proteins at NCBI
Search summary 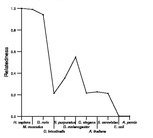
Figure data | ||
Related human proteins:Protein Relative score Description Self-match 1.000 RAB40C, member RAS oncogene family RAB40B 0.807 RAB40B, member RAS oncogene family RAB40AL 0.740 RAB40A, member RAS oncogene family-like RAB40A 0.740 RAB40A, member RAS oncogene family RAB13 0.225 RAB13, member RAS oncogene family RAB8A 0.222 mel transforming oncogene RAB10 0.220 ras-related GTP-binding protein RAB10 RAB8B 0.220 RAB8B, member RAS oncogene family LOC100131294 0.216 PREDICTED: similar to RAB13, member RAS oncogene fa... LOC100131294 0.216 PREDICTED: similar to hCG24991 LOC100131294 0.216 PREDICTED: similar to hCG24991 RAB11B 0.204 RAB11B, member RAS oncogene family RAB1A 0.200 RAB1A, member RAS oncogene family isoform 1 RAB11A 0.200 Ras-related protein Rab-11A RAB1B 0.195 RAB1B, member RAS oncogene family RAB35 0.195 RAB35, member RAS oncogene family RAB43 0.185 RAB43 protein RAB3C 0.176 RAB3C, member RAS oncogene family RAB12 0.173 RAB12, member RAS oncogene family RAB3B 0.171 RAB3B, member RAS oncogene family RAB3A 0.171 RAB3A, member RAS oncogene family RAB26 0.171 RAB26, member RAS oncogene family RAB3D 0.171 RAB3D, member RAS oncogene family RAB2A 0.165 RAB2A, member RAS oncogene family RAB14 0.164 GTPase Rab14 RAB4B 0.164 ras-related GTP-binding protein 4b RAB2B 0.164 RAB2B protein isoform 1 RAB27A 0.164 Ras-related protein Rab-27A RAB27A 0.164 Ras-related protein Rab-27A RAB27A 0.164 Ras-related protein Rab-27AHuman BLASTP results (used to prepare the table) | |||
Gene descriptions are from NCBI RefSeq. Search results were obtained with NCBI BLAST and RefSeq entries. When identical proteins are present, the self-match may not be listed first in BLASTP output. In such cases, the table above has been reordered to place it first.
See About the Figures for the scoring system used in the figure above right. The same scoring system was used in the table of BLASTP results.
Guide to the Human Genome
Copyright © 2010 by Stewart Scherer. All rights reserved.
