
| Name: TDGF1 | Sequence: fasta or formatted (188aa) | NCBI GI: 4507425 | |
|
Description: teratocarcinoma-derived growth factor 1
|
Referenced in:
| ||
|
Composition:
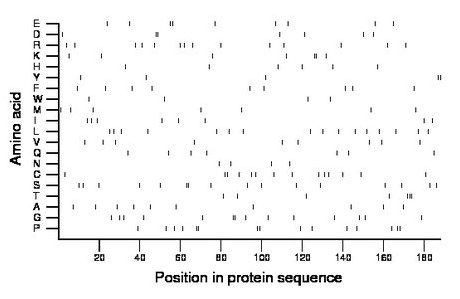
Amino acid Percentage Count Longest homopolymer A alanine 5.3 10 1 C cysteine 7.4 14 2 D aspartate 3.7 7 2 E glutamate 4.8 9 2 F phenylalanine 4.8 9 1 G glycine 7.4 14 2 H histidine 3.2 6 1 I isoleucine 4.3 8 1 K lysine 3.7 7 2 L leucine 8.5 16 1 M methionine 3.7 7 1 N asparagine 2.1 4 1 P proline 8.0 15 2 Q glutamine 3.7 7 1 R arginine 7.4 14 1 S serine 8.5 16 2 T threonine 3.7 7 3 V valine 4.8 9 1 W tryptophan 2.1 4 1 Y tyrosine 2.7 5 2 |
Comparative genomics:
Search single species RefSeq proteins at NCBI
Search summary 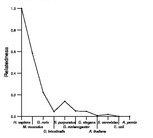
Figure data | ||
Related human proteins:Protein Relative score Description Self-match 1.000 teratocarcinoma-derived growth factor 1 LOC100132934 0.613 PREDICTED: similar to hCG1644233 LOC100132934 0.605 PREDICTED: similar to hCG1644233 CFC1 0.174 cryptic CFC1B 0.174 cripto, FRL-1, cryptic family 1B NOTCH1 0.057 notch1 preproprotein WIF1 0.057 WNT inhibitory factor 1 precursor FAT2 0.052 FAT tumor suppressor 2 precursor VWDE 0.044 von Willebrand factor D and EGF domains NELL1 0.044 nel-like 1 isoform 2 precursor NELL2 0.044 NEL-like protein 2 isoform d NELL2 0.044 NEL-like protein 2 isoform c NELL2 0.044 NEL-like protein 2 isoform b precursor NELL2 0.044 NEL-like protein 2 isoform a NELL2 0.044 NEL-like protein 2 isoform b precursor MEGF6 0.044 EGF-like-domain, multiple 3 EYS 0.039 eyes shut homolog isoform 1 FBN1 0.039 fibrillin 1 precursor DLL4 0.036 delta-like 4 protein precursor FAT4 0.036 FAT tumor suppressor homolog 4 NOTCH4 0.036 notch4 preproprotein EGFL8 0.036 NG3 protein EGFL7 0.036 EGF-like-domain, multiple 7 EGFL7 0.036 EGF-like-domain, multiple 7 PLAT 0.034 plasminogen activator, tissue isoform 1 preproprotein... NOTCH3 0.034 Notch homolog 3 NOTCH2 0.034 notch 2 preproprotein HGFAC 0.034 HGF activator preproprotein DLL3 0.034 delta-like 3 protein isoform 1 precursor DLL3 0.034 delta-like 3 protein isoform 2 precursorHuman BLASTP results (used to prepare the table) | |||
Gene descriptions are from NCBI RefSeq. Search results were obtained with NCBI BLAST and RefSeq entries. When identical proteins are present, the self-match may not be listed first in BLASTP output. In such cases, the table above has been reordered to place it first.
See About the Figures for the scoring system used in the figure above right. The same scoring system was used in the table of BLASTP results.
Guide to the Human Genome
Copyright © 2010 by Stewart Scherer. All rights reserved.
