
| Name: STAM | Sequence: fasta or formatted (540aa) | NCBI GI: 4507249 | |
|
Description: signal transducing adaptor molecule 1
|
Referenced in: Non-Receptor Tyrosine Kinase Pathways
| ||
|
Composition:
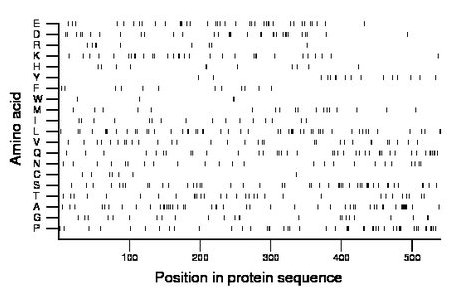
Amino acid Percentage Count Longest homopolymer A alanine 8.9 48 4 C cysteine 1.3 7 1 D aspartate 5.9 32 2 E glutamate 7.0 38 3 F phenylalanine 2.2 12 1 G glycine 4.4 24 2 H histidine 2.0 11 1 I isoleucine 3.1 17 2 K lysine 5.7 31 2 L leucine 9.6 52 2 M methionine 3.5 19 1 N asparagine 4.4 24 1 P proline 8.5 46 3 Q glutamine 7.6 41 2 R arginine 1.7 9 2 S serine 8.7 47 2 T threonine 5.7 31 2 V valine 5.7 31 2 W tryptophan 0.7 4 2 Y tyrosine 3.0 16 2 |
Comparative genomics:
Search single species RefSeq proteins at NCBI
Search summary 
Figure data | ||
Related human proteins:Protein Relative score Description Self-match 1.000 signal transducing adaptor molecule 1 STAM2 0.506 signal transducing adaptor molecule 2 TOM1 0.076 target of myb1 isoform 2 TOM1 0.076 target of myb1 isoform 1 TOM1L2 0.072 target of myb1-like 2 isoform 3 HGS 0.062 hepatocyte growth factor-regulated tyrosine kinase su... TOM1 0.059 target of myb1 isoform 4 TOM1 0.058 target of myb1 isoform 3 TOM1L1 0.048 target of myb1-like 1 GGA3 0.047 ADP-ribosylation factor binding protein 3 isoform lo... GRAP2 0.046 GRB2-related adaptor protein 2 GRB2 0.042 growth factor receptor-bound protein 2 isoform 1 [Hom... GRB2 0.042 growth factor receptor-bound protein 2 isoform 2 [Ho... ITSN1 0.040 intersectin 1 isoform ITSN-l ITSN1 0.040 intersectin 1 isoform ITSN-s ITSN2 0.038 intersectin 2 isoform 3 ITSN2 0.038 intersectin 2 isoform 1 GGA1 0.037 golgi associated, gamma adaptin ear containing, ARF b... GGA1 0.037 golgi associated, gamma adaptin ear containing, ARF ... ITSN2 0.036 intersectin 2 isoform 2 SH3D19 0.033 SH3 domain containing 19 isoform c SH3D19 0.033 SH3 domain containing 19 isoform b SH3D19 0.033 SH3 domain containing 19 isoform a GGA2 0.032 ADP-ribosylation factor binding protein 2 ASAP1 0.032 development and differentiation enhancing factor 1 [... STAC3 0.031 SH3 and cysteine rich domain 3 STAC 0.030 SH3 and cysteine rich domain SH3YL1 0.029 SH3 domain containing, Ysc84-like 1 isoform 1 [Homo... OSTF1 0.029 osteoclast stimulating factor 1 SORBS2 0.028 sorbin and SH3 domain containing 2 isoform 8Human BLASTP results (used to prepare the table) | |||
Gene descriptions are from NCBI RefSeq. Search results were obtained with NCBI BLAST and RefSeq entries. When identical proteins are present, the self-match may not be listed first in BLASTP output. In such cases, the table above has been reordered to place it first.
See About the Figures for the scoring system used in the figure above right. The same scoring system was used in the table of BLASTP results.
Guide to the Human Genome
Copyright © 2010 by Stewart Scherer. All rights reserved.
