
| Name: CCKAR | Sequence: fasta or formatted (428aa) | NCBI GI: 4502607 | |
|
Description: cholecystokinin A receptor
|
Referenced in: Stomach, Small Intestine, and Colon
| ||
|
Composition:
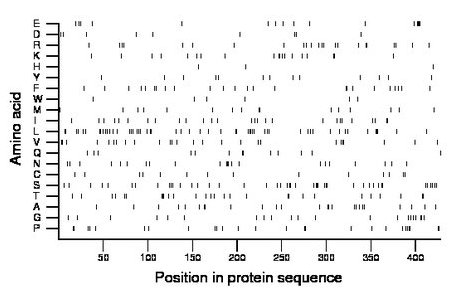
Amino acid Percentage Count Longest homopolymer A alanine 5.8 25 2 C cysteine 3.3 14 2 D aspartate 2.1 9 1 E glutamate 3.7 16 4 F phenylalanine 5.6 24 2 G glycine 4.9 21 2 H histidine 0.7 3 1 I isoleucine 6.3 27 2 K lysine 4.4 19 2 L leucine 12.4 53 3 M methionine 3.7 16 2 N asparagine 5.1 22 3 P proline 6.1 26 2 Q glutamine 3.0 13 2 R arginine 5.4 23 2 S serine 10.3 44 3 T threonine 6.5 28 3 V valine 6.1 26 2 W tryptophan 1.4 6 1 Y tyrosine 3.0 13 1 |
Comparative genomics:
Search single species RefSeq proteins at NCBI
Search summary 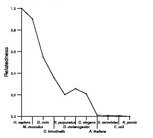
Figure data | ||
Related human proteins:Protein Relative score Description Self-match 1.000 cholecystokinin A receptor CCKBR 0.432 cholecystokinin B receptor NPFFR1 0.164 neuropeptide FF receptor 1 NPFFR2 0.159 neuropeptide FF receptor 2 isoform 2 NPFFR2 0.159 neuropeptide FF receptor 2 isoform 1 NPFFR2 0.159 neuropeptide FF receptor 2 isoform 3 HCRTR1 0.157 orexin receptor 1 HCRTR2 0.147 orexin receptor 2 TACR3 0.139 tachykinin receptor 3 TACR2 0.138 tachykinin receptor 2 BRS3 0.137 bombesin-like receptor 3 QRFPR 0.134 G protein-coupled receptor 103 TACR1 0.131 tachykinin receptor 1 isoform long SSTR2 0.128 somatostatin receptor 2 NPY1R 0.127 neuropeptide Y receptor Y1 SSTR4 0.122 somatostatin receptor 4 NPY5R 0.122 neuropeptide Y receptor Y5 TRHR 0.115 thyrotropin-releasing hormone receptor ADRB1 0.114 beta-1-adrenergic receptor NMBR 0.110 neuromedin B receptor KISS1R 0.108 G protein-coupled receptor 54 AVPR1B 0.108 arginine vasopressin receptor 1B NMUR1 0.108 neuromedin U receptor 1 PRLHR 0.108 G protein-coupled receptor 10 OXTR 0.107 oxytocin receptor GALR1 0.107 galanin receptor 1 TACR1 0.107 tachykinin receptor 1 isoform short OPRL1 0.106 opiate receptor-like 1 OPRL1 0.106 opiate receptor-like 1 GALR2 0.101 galanin receptor 2Human BLASTP results (used to prepare the table) | |||
Gene descriptions are from NCBI RefSeq. Search results were obtained with NCBI BLAST and RefSeq entries. When identical proteins are present, the self-match may not be listed first in BLASTP output. In such cases, the table above has been reordered to place it first.
See About the Figures for the scoring system used in the figure above right. The same scoring system was used in the table of BLASTP results.
Guide to the Human Genome
Copyright © 2010 by Stewart Scherer. All rights reserved.
