
| Name: MSN | Sequence: fasta or formatted (577aa) | NCBI GI: 4505257 | |
|
Description: moesin
|
Referenced in:
| ||
|
Composition:
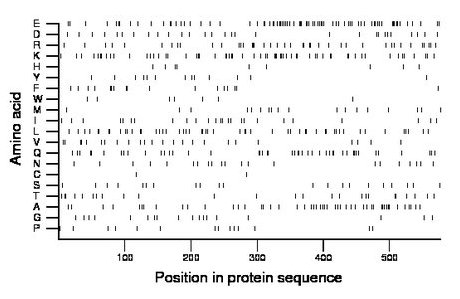
Amino acid Percentage Count Longest homopolymer A alanine 8.5 49 1 C cysteine 0.3 2 1 D aspartate 5.2 30 2 E glutamate 13.7 79 3 F phenylalanine 3.1 18 2 G glycine 3.1 18 1 H histidine 1.6 9 1 I isoleucine 4.3 25 1 K lysine 10.7 62 3 L leucine 9.2 53 2 M methionine 3.3 19 1 N asparagine 3.6 21 1 P proline 2.6 15 2 Q glutamine 7.8 45 2 R arginine 7.1 41 3 S serine 3.6 21 1 T threonine 4.5 26 2 V valine 4.2 24 2 W tryptophan 1.2 7 1 Y tyrosine 2.3 13 1 |
Comparative genomics:
Search single species RefSeq proteins at NCBI
Search summary 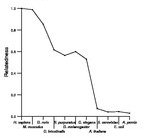
Figure data | ||
Related human proteins:Protein Relative score Description Self-match 1.000 moesin RDX 0.832 radixin EZR 0.753 ezrin EZR 0.753 ezrin NF2 0.431 neurofibromin 2 isoform 1 NF2 0.425 neurofibromin 2 isoform 2 NF2 0.425 neurofibromin 2 isoform 2 NF2 0.425 neurofibromin 2 isoform 2 NF2 0.367 neurofibromin 2 isoform 5 NF2 0.360 neurofibromin 2 isoform 6 NF2 0.317 neurofibromin 2 isoform 7 NF2 0.317 neurofibromin 2 isoform 7 NF2 0.127 neurofibromin 2 isoform 8 FRMD4B 0.115 FERM domain containing 4B FRMD4A 0.115 FERM domain containing 4A EPB41L1 0.109 erythrocyte membrane protein band 4.1-like 1 isoform... EPB41 0.108 erythrocyte membrane protein band 4.1 (elliptocytosi... EPB41L1 0.106 erythrocyte membrane protein band 4.1-like 1 isoform... EPB41 0.103 erythrocyte membrane protein band 4.1 (elliptocytosis... FARP1 0.103 FERM, RhoGEF, and pleckstrin domain protein 1 isoform... EPB41L2 0.103 erythrocyte membrane protein band 4.1-like 2 isofor... EPB41L2 0.103 erythrocyte membrane protein band 4.1-like 2 isofor... EPB41L2 0.103 erythrocyte membrane protein band 4.1-like 2 isoform ... EPB41L3 0.102 erythrocyte membrane protein band 4.1-like 3 PTPN4 0.101 protein tyrosine phosphatase, non-receptor type 4 [Ho... PTPN3 0.099 protein tyrosine phosphatase, non-receptor type 3 i... PTPN3 0.099 protein tyrosine phosphatase, non-receptor type 3 i... FARP2 0.099 FERM, RhoGEF and pleckstrin domain protein 2 EPB41L4A 0.094 erythrocyte protein band 4.1-like 4 PTPN13 0.092 protein tyrosine phosphatase, non-receptor type 13 i...Human BLASTP results (used to prepare the table) | |||
Gene descriptions are from NCBI RefSeq. Search results were obtained with NCBI BLAST and RefSeq entries. When identical proteins are present, the self-match may not be listed first in BLASTP output. In such cases, the table above has been reordered to place it first.
See About the Figures for the scoring system used in the figure above right. The same scoring system was used in the table of BLASTP results.
Guide to the Human Genome
Copyright © 2010 by Stewart Scherer. All rights reserved.
