
| Name: DR1 | Sequence: fasta or formatted (176aa) | NCBI GI: 4503381 | |
|
Description: down-regulator of transcription 1
|
Referenced in: RNA Polymerase and General Transcription Factors
| ||
|
Composition:
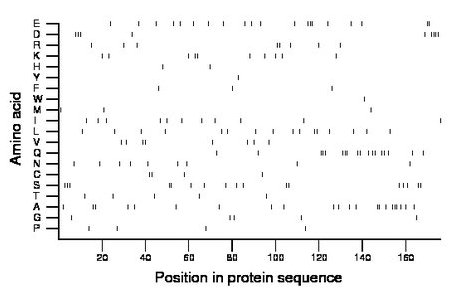
Amino acid Percentage Count Longest homopolymer A alanine 12.5 22 3 C cysteine 2.3 4 2 D aspartate 5.1 9 4 E glutamate 11.4 20 3 F phenylalanine 1.7 3 1 G glycine 2.8 5 1 H histidine 1.1 2 1 I isoleucine 6.2 11 1 K lysine 5.7 10 2 L leucine 9.1 16 2 M methionine 1.7 3 1 N asparagine 5.1 9 1 P proline 2.3 4 1 Q glutamine 10.2 18 3 R arginine 4.5 8 2 S serine 9.7 17 3 T threonine 2.8 5 1 V valine 4.5 8 2 W tryptophan 0.6 1 1 Y tyrosine 0.6 1 1 |
Comparative genomics:
Search single species RefSeq proteins at NCBI
Search summary 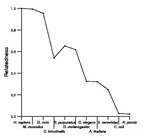
Figure data | ||
Related human proteins:Protein Relative score Description Self-match 1.000 down-regulator of transcription 1 NFYB 0.153 nuclear transcription factor Y, beta POLE3 0.111 DNA-directed DNA polymerase epsilon 3 BRD4 0.045 bromodomain-containing protein 4 isoform long GBP5 0.045 guanylate-binding protein 5 GBP5 0.045 guanylate-binding protein 5 CROCC 0.045 ciliary rootlet coiled-coil TSEN34 0.041 tRNA-intron endonuclease 34 TSEN34 0.041 tRNA-intron endonuclease 34 TAF12 0.038 TAF12 RNA polymerase II, TATA box binding protein (... TAF12 0.038 TAF12 RNA polymerase II, TATA box binding protein (TB... DEF6 0.038 differentially expressed in FDCP 6 homolog TBP 0.038 TATA box binding protein FOXP2 0.035 forkhead box P2 isoform I FOXP2 0.035 forkhead box P2 isoform III FOXP2 0.035 forkhead box P2 isoform II MED12 0.035 mediator complex subunit 12 ATAD2 0.035 ATPase family, AAA domain containing 2 SLK 0.035 serine/threonine kinase 2 MN1 0.032 meningioma 1 ZNF853 0.032 zinc finger protein 853 FRMPD3 0.032 PREDICTED: FERM and PDZ domain containing 3 FRMPD3 0.032 PREDICTED: FERM and PDZ domain containing 3 FRMPD3 0.032 PREDICTED: FERM and PDZ domain containing 3 MLL2 0.032 myeloid/lymphoid or mixed-lineage leukemia 2 TP53BP2 0.032 tumor protein p53 binding protein, 2 isoform 1 [Hom... TP53BP2 0.032 tumor protein p53 binding protein, 2 isoform 2 EPC2 0.032 enhancer of polycomb homolog 2 WWC1 0.029 WW and C2 domain containing 1 isoform 3 WWC1 0.029 WW and C2 domain containing 1 isoform 2Human BLASTP results (used to prepare the table) | |||
Gene descriptions are from NCBI RefSeq. Search results were obtained with NCBI BLAST and RefSeq entries. When identical proteins are present, the self-match may not be listed first in BLASTP output. In such cases, the table above has been reordered to place it first.
See About the Figures for the scoring system used in the figure above right. The same scoring system was used in the table of BLASTP results.
Guide to the Human Genome
Copyright © 2010 by Stewart Scherer. All rights reserved.
