
| Name: EPC2 | Sequence: fasta or formatted (807aa) | NCBI GI: 194272186 | |
|
Description: enhancer of polycomb homolog 2
|
Referenced in: Histones, Related Proteins, and Modifying Enzymes
| ||
|
Composition:
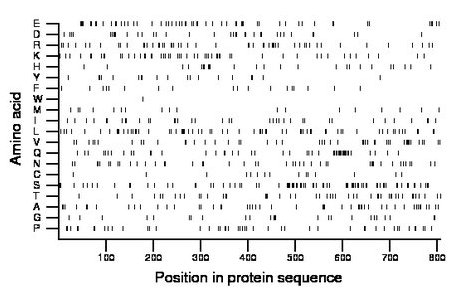
Amino acid Percentage Count Longest homopolymer A alanine 6.3 51 2 C cysteine 1.9 15 1 D aspartate 4.5 36 2 E glutamate 7.4 60 3 F phenylalanine 2.2 18 1 G glycine 3.3 27 2 H histidine 3.2 26 2 I isoleucine 4.6 37 1 K lysine 6.7 54 3 L leucine 8.4 68 3 M methionine 2.4 19 1 N asparagine 5.9 48 2 P proline 5.7 46 1 Q glutamine 6.2 50 3 R arginine 6.9 56 3 S serine 9.9 80 4 T threonine 6.1 49 3 V valine 5.8 47 2 W tryptophan 0.1 1 1 Y tyrosine 2.4 19 2 |
Comparative genomics:
Search single species RefSeq proteins at NCBI
Search summary 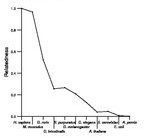
Figure data | ||
Related human proteins:Protein Relative score Description Self-match 1.000 enhancer of polycomb homolog 2 EPC1 0.496 enhancer of polycomb 1 MUC12 0.013 PREDICTED: mucin 12 VEZF1 0.013 zinc finger protein 161 MUC3A 0.011 PREDICTED: mucin 3A, intestinal EP400 0.011 E1A binding protein p400 TBP 0.011 TATA box binding protein BRPF1 0.011 bromodomain and PHD finger-containing protein 1 isof... BRPF1 0.011 bromodomain and PHD finger-containing protein 1 isof... FOXP2 0.010 forkhead box P2 isoform I FOXP2 0.010 forkhead box P2 isoform III FOXP2 0.010 forkhead box P2 isoform II THAP11 0.009 THAP domain containing 11 BRD1 0.009 bromodomain containing protein 1 TOX3 0.009 TOX high mobility group box family member 3 isoform... TOX3 0.009 TOX high mobility group box family member 3 isoform... POU2F1 0.009 POU class 2 homeobox 1 MUC12 0.009 PREDICTED: mucin 12 TCOF1 0.009 Treacher Collins-Franceschetti syndrome 1 isoform d... TCOF1 0.009 Treacher Collins-Franceschetti syndrome 1 isoform b ... CCDC150 0.009 coiled-coil domain containing 150 CCDC39 0.009 coiled-coil domain containing 39 MAML2 0.009 mastermind-like 2 MUC12 0.009 PREDICTED: mucin 12 MLL2 0.009 myeloid/lymphoid or mixed-lineage leukemia 2 PHF15 0.009 PHD finger protein 15 BRPF3 0.009 bromodomain and PHD finger containing, 3 MUC3A 0.008 PREDICTED: mucin 3A, cell surface associated, parti... LOC100294238 0.008 PREDICTED: hypothetical protein LOC100294204 0.008 PREDICTED: hypothetical proteinHuman BLASTP results (used to prepare the table) | |||
Gene descriptions are from NCBI RefSeq. Search results were obtained with NCBI BLAST and RefSeq entries. When identical proteins are present, the self-match may not be listed first in BLASTP output. In such cases, the table above has been reordered to place it first.
See About the Figures for the scoring system used in the figure above right. The same scoring system was used in the table of BLASTP results.
Guide to the Human Genome
Copyright © 2010 by Stewart Scherer. All rights reserved.
