
| Name: INTS5 | Sequence: fasta or formatted (1019aa) | NCBI GI: 44771201 | |
|
Description: integrator complex subunit 5
|
Referenced in:
| ||
|
Composition:
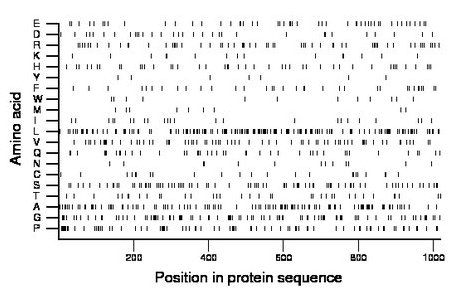
Amino acid Percentage Count Longest homopolymer A alanine 10.6 108 3 C cysteine 2.3 23 2 D aspartate 3.1 32 1 E glutamate 5.2 53 3 F phenylalanine 3.3 34 2 G glycine 9.7 99 3 H histidine 4.3 44 2 I isoleucine 2.5 25 2 K lysine 1.5 15 1 L leucine 15.5 158 4 M methionine 1.0 10 1 N asparagine 1.3 13 1 P proline 8.4 86 5 Q glutamine 4.4 45 2 R arginine 6.0 61 2 S serine 8.4 86 3 T threonine 3.6 37 2 V valine 7.0 71 2 W tryptophan 1.2 12 1 Y tyrosine 0.7 7 1 |
Comparative genomics:
Search single species RefSeq proteins at NCBI
Search summary 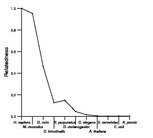
Figure data | ||
Related human proteins:Protein Relative score Description Self-match 1.000 integrator complex subunit 5 GPR150 0.006 G protein-coupled receptor 150 AHDC1 0.005 AT hook, DNA binding motif, containing 1 EP400 0.005 E1A binding protein p400 MYPOP 0.005 Myb protein P42POP IGSF9 0.005 immunoglobulin superfamily, member 9 isoform a [Hom... IGSF9 0.005 immunoglobulin superfamily, member 9 isoform b [Hom... YBX2 0.005 Y box binding protein 2 RNF19B 0.005 ring finger protein 19B isoform a RNF19B 0.005 ring finger protein 19B isoform b ANKRD43 0.005 ankyrin repeat domain 43 RELA 0.004 v-rel reticuloendotheliosis viral oncogene homolog ... RELA 0.004 v-rel reticuloendotheliosis viral oncogene homolog ... AKT1S1 0.004 AKT1 substrate 1 (proline-rich) AKT1S1 0.004 AKT1 substrate 1 (proline-rich) AKT1S1 0.004 AKT1 substrate 1 (proline-rich) COL8A1 0.004 alpha 1 type VIII collagen precursor COL8A1 0.004 alpha 1 type VIII collagen precursor KLF16 0.004 BTE-binding protein 4 LOC100291609 0.004 PREDICTED: hypothetical protein XP_002346061 SLC22A6 0.004 solute carrier family 22 member 6 isoform b SLC22A6 0.004 solute carrier family 22 member 6 isoform a MAP1A 0.004 microtubule-associated protein 1A SALL3 0.004 sal-like 3 ABI1 0.004 abl-interactor 1 isoform a MED25 0.004 mediator complex subunit 25 LRP10 0.004 low density lipoprotein receptor-related protein 10 ... KIF3C 0.004 kinesin family member 3C BCL9L 0.004 B-cell CLL/lymphoma 9-like JUND 0.004 jun D proto-oncogeneHuman BLASTP results (used to prepare the table) | |||
Gene descriptions are from NCBI RefSeq. Search results were obtained with NCBI BLAST and RefSeq entries. When identical proteins are present, the self-match may not be listed first in BLASTP output. In such cases, the table above has been reordered to place it first.
See About the Figures for the scoring system used in the figure above right. The same scoring system was used in the table of BLASTP results.
Guide to the Human Genome
Copyright © 2010 by Stewart Scherer. All rights reserved.
