
| Name: KIAA1199 | Sequence: fasta or formatted (1361aa) | NCBI GI: 38638698 | |
|
Description: KIAA1199
| Not currently referenced in the text | ||
|
Composition:
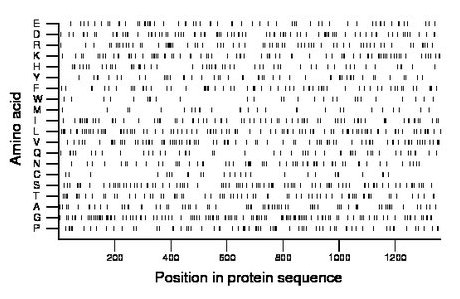
Amino acid Percentage Count Longest homopolymer A alanine 5.4 73 3 C cysteine 2.0 27 1 D aspartate 6.2 85 2 E glutamate 4.6 62 2 F phenylalanine 5.0 68 2 G glycine 9.0 123 2 H histidine 4.1 56 2 I isoleucine 5.8 79 2 K lysine 6.2 84 4 L leucine 7.6 103 3 M methionine 2.1 28 2 N asparagine 4.4 60 3 P proline 5.1 70 2 Q glutamine 3.6 49 2 R arginine 4.9 67 1 S serine 6.6 90 3 T threonine 5.3 72 2 V valine 6.4 87 3 W tryptophan 2.0 27 1 Y tyrosine 3.7 51 2 |
Comparative genomics:
Search single species RefSeq proteins at NCBI
Search summary 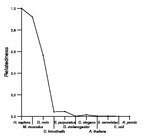
Figure data | ||
Related human proteins:Protein Relative score Description Self-match 1.000 KIAA1199 TMEM2 0.308 transmembrane protein 2 isoform a TMEM2 0.285 transmembrane protein 2 isoform b PKHD1L1 0.041 fibrocystin L POMGNT1 0.015 O-linked mannose beta1,2-N-acetylglucosaminyltransf... PKHD1 0.013 fibrocystin isoform 2 PKHD1 0.013 fibrocystin isoform 1 FAM3C 0.012 family with sequence similarity 3, member C precurso... FAM3C 0.012 family with sequence similarity 3, member C precursor... FAM3D 0.011 family with sequence similarity 3, member D FAM3A 0.009 family 3, member A protein FAM3B 0.008 family with sequence similarity 3, member B isoform ... FAM3B 0.008 family with sequence similarity 3, member B isoform ... MUC5AC 0.007 mucin 5AC MUC5B 0.007 mucin 5, subtype B, tracheobronchial CILP 0.006 cartilage intermediate layer protein CILP2 0.006 cartilage intermediate layer protein 2 APC 0.005 adenomatous polyposis coli APC 0.005 adenomatous polyposis coli APC 0.005 adenomatous polyposis coli LOC100132635 0.003 PREDICTED: similar to mucin 5, partial GALC 0.003 galactosylceramidase isoform a precursor GALC 0.003 galactosylceramidase isoform b precursor LOC100293983 0.003 PREDICTED: similar to mucin, partial PPWD1 0.003 peptidylprolyl isomerase domain and WD repeat contai... POTEE 0.002 protein expressed in prostate, ovary, testis, and p... LOC653781 0.002 PREDICTED: similar to protein expressed in prostate... LOC653269 0.002 PREDICTED: similar to protein expressed in prostate,... CHADL 0.002 chondroadherin-likeHuman BLASTP results (used to prepare the table) | |||
Gene descriptions are from NCBI RefSeq. Search results were obtained with NCBI BLAST and RefSeq entries. When identical proteins are present, the self-match may not be listed first in BLASTP output. In such cases, the table above has been reordered to place it first.
See About the Figures for the scoring system used in the figure above right. The same scoring system was used in the table of BLASTP results.
Guide to the Human Genome
Copyright © 2010 by Stewart Scherer. All rights reserved.
