
| Name: GNPTAB | Sequence: fasta or formatted (1256aa) | NCBI GI: 38202211 | |
|
Description: N-acetylglucosamine-1-phosphate transferase
|
Referenced in:
| ||
|
Composition:
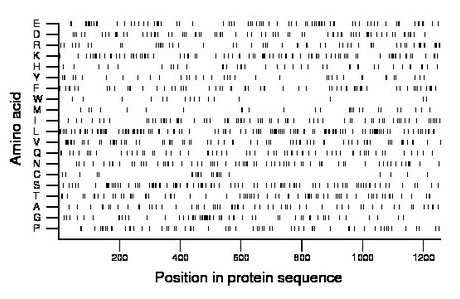
Amino acid Percentage Count Longest homopolymer A alanine 4.5 57 1 C cysteine 1.8 22 1 D aspartate 5.9 74 2 E glutamate 6.4 81 3 F phenylalanine 4.9 61 2 G glycine 4.9 61 4 H histidine 3.2 40 1 I isoleucine 5.6 70 2 K lysine 7.4 93 3 L leucine 10.1 127 2 M methionine 2.1 27 1 N asparagine 5.6 70 2 P proline 5.1 64 2 Q glutamine 4.9 61 2 R arginine 4.5 56 3 S serine 7.1 89 2 T threonine 5.8 73 2 V valine 6.1 76 3 W tryptophan 1.3 16 1 Y tyrosine 3.0 38 2 |
Comparative genomics:
Search single species RefSeq proteins at NCBI
Search summary 
Figure data | ||
Related human proteins:Protein Relative score Description Self-match 1.000 N-acetylglucosamine-1-phosphate transferase NOTCH2 0.012 notch 2 preproprotein NOTCH3 0.011 Notch homolog 3 NOTCH4 0.010 notch4 preproprotein NOTCH1 0.010 notch1 preproprotein MYH9 0.007 myosin, heavy polypeptide 9, non-muscle KRTAP5-6 0.007 keratin associated protein 5-6 C10orf68 0.005 chromosome 10 open reading frame 68 PAPPA 0.005 pregnancy-associated plasma protein A preproprotein ... KRTAP5-3 0.005 keratin associated protein 5-3 DIP2B 0.005 DIP2 disco-interacting protein 2 homolog B KRTAP17-1 0.005 keratin associated protein 17-1 KRTAP5-2 0.005 keratin associated protein 5-2 FHAD1 0.005 forkhead-associated (FHA) phosphopeptide binding do... HECTD1 0.004 HECT domain containing 1 KRTAP5-5 0.004 keratin associated protein 5-5 DIP2A 0.004 disco-interacting protein 2A isoform g DIP2A 0.004 disco-interacting protein 2A isoform a PEAR1 0.004 platelet endothelial aggregation receptor 1 PAPPA2 0.004 pappalysin 2 isoform 1 DIP2A 0.004 disco-interacting protein 2A isoform f DIP2A 0.004 disco-interacting protein 2A isoform d DIP2A 0.004 disco-interacting protein 2A isoform c DIP2A 0.004 disco-interacting protein 2A isoform b DIP2C 0.004 DIP2 disco-interacting protein 2 homolog C LCE1F 0.004 late cornified envelope 1F KRTAP5-9 0.004 keratin associated protein 5-9 LOR 0.004 loricrin TLX1 0.004 T-cell leukemia homeobox 1 SOX4 0.003 SRY (sex determining region Y)-box 4Human BLASTP results (used to prepare the table) | |||
Gene descriptions are from NCBI RefSeq. Search results were obtained with NCBI BLAST and RefSeq entries. When identical proteins are present, the self-match may not be listed first in BLASTP output. In such cases, the table above has been reordered to place it first.
See About the Figures for the scoring system used in the figure above right. The same scoring system was used in the table of BLASTP results.
Guide to the Human Genome
Copyright © 2010 by Stewart Scherer. All rights reserved.
