
| Name: RAB7A | Sequence: fasta or formatted (207aa) | NCBI GI: 34147513 | |
|
Description: RAB7, member RAS oncogene family
|
Referenced in: Lysosomes and Related Organelles
| ||
|
Composition:
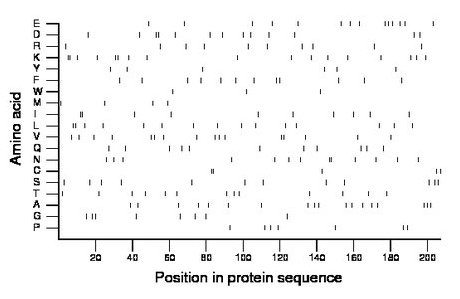
Amino acid Percentage Count Longest homopolymer A alanine 8.7 18 1 C cysteine 2.4 5 2 D aspartate 6.3 13 2 E glutamate 6.8 14 1 F phenylalanine 5.8 12 1 G glycine 3.9 8 1 H histidine 0.0 0 0 I isoleucine 4.8 10 2 K lysine 8.2 17 2 L leucine 7.2 15 2 M methionine 1.9 4 1 N asparagine 6.3 13 2 P proline 3.4 7 1 Q glutamine 5.3 11 1 R arginine 4.8 10 1 S serine 5.8 12 1 T threonine 6.3 13 1 V valine 7.7 16 2 W tryptophan 1.4 3 1 Y tyrosine 2.9 6 1 |
Comparative genomics:
Search single species RefSeq proteins at NCBI
Search summary 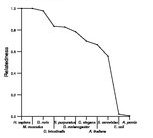
Figure data | ||
Related human proteins:Protein Relative score Description Self-match 1.000 RAB7, member RAS oncogene family RAB9B 0.471 RAB9B, member RAS oncogene family RAB9A 0.466 RAB9A, member RAS oncogene family RAB7B 0.399 RAB7B, member RAS oncogene family RAB5C 0.275 RAB5C, member RAS oncogene family isoform a RAB5C 0.275 RAB5C, member RAS oncogene family isoform b RAB6B 0.272 RAB6B, member RAS oncogene family RAB5B 0.272 RAB5B, member RAS oncogene family LOC100131294 0.272 PREDICTED: similar to RAB13, member RAS oncogene fa... LOC100131294 0.272 PREDICTED: similar to hCG24991 LOC100131294 0.272 PREDICTED: similar to hCG24991 RAB11B 0.270 RAB11B, member RAS oncogene family RAB11A 0.270 Ras-related protein Rab-11A RAB6A 0.270 RAB6A, member RAS oncogene family isoform b RAB5A 0.270 RAB5A, member RAS oncogene family RAB13 0.270 RAB13, member RAS oncogene family RAB6A 0.267 RAB6A, member RAS oncogene family isoform a RAB31 0.262 RAB31, member RAS oncogene family RAB1A 0.260 RAB1A, member RAS oncogene family isoform 1 RAB1B 0.260 RAB1B, member RAS oncogene family RAB30 0.260 RAB30, member RAS oncogene family RAB2B 0.257 RAB2B protein isoform 1 RAB10 0.257 ras-related GTP-binding protein RAB10 RAB2A 0.257 RAB2A, member RAS oncogene family RAB8B 0.254 RAB8B, member RAS oncogene family RAB38 0.254 RAB38 RAB23 0.254 Ras-related protein Rab-23 RAB23 0.254 Ras-related protein Rab-23 RAB27B 0.252 RAB27B, member RAS oncogene family RAB18 0.252 RAB18, member RAS oncogene familyHuman BLASTP results (used to prepare the table) | |||
Gene descriptions are from NCBI RefSeq. Search results were obtained with NCBI BLAST and RefSeq entries. When identical proteins are present, the self-match may not be listed first in BLASTP output. In such cases, the table above has been reordered to place it first.
See About the Figures for the scoring system used in the figure above right. The same scoring system was used in the table of BLASTP results.
Guide to the Human Genome
Copyright © 2010 by Stewart Scherer. All rights reserved.
