
| Name: NFS1 | Sequence: fasta or formatted (457aa) | NCBI GI: 32307132 | |
|
Description: NFS1 nitrogen fixation 1
|
Referenced in: Amino Acid Catabolism
| ||
|
Composition:
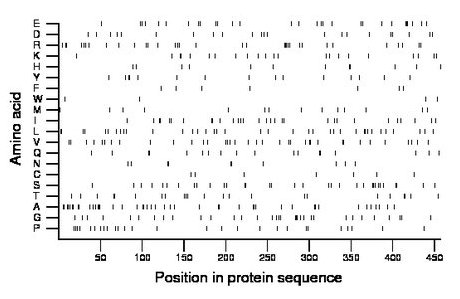
Amino acid Percentage Count Longest homopolymer A alanine 9.8 45 3 C cysteine 1.5 7 1 D aspartate 4.8 22 1 E glutamate 6.3 29 3 F phenylalanine 1.5 7 1 G glycine 7.2 33 3 H histidine 2.6 12 2 I isoleucine 6.6 30 2 K lysine 4.8 22 2 L leucine 8.1 37 2 M methionine 3.1 14 1 N asparagine 2.2 10 2 P proline 5.9 27 1 Q glutamine 3.9 18 2 R arginine 7.2 33 3 S serine 7.2 33 2 T threonine 5.0 23 2 V valine 7.9 36 2 W tryptophan 0.9 4 1 Y tyrosine 3.3 15 2 |
Comparative genomics:
Search single species RefSeq proteins at NCBI
Search summary 
Figure data | ||
Related human proteins:Protein Relative score Description Self-match 1.000 NFS1 nitrogen fixation 1 SCLY 0.213 selenocysteine lyase MOCOS 0.036 molybdenum cofactor sulfurase LOC100293861 0.015 PREDICTED: hypothetical protein LOC100291362 0.015 PREDICTED: hypothetical protein XP_002346476 LOC100286920 0.015 PREDICTED: hypothetical protein XP_002342339 LOC100291637 0.014 PREDICTED: hypothetical protein XP_002346335 LOC100289469 0.014 PREDICTED: hypothetical protein LOC100289469 0.014 PREDICTED: hypothetical protein XP_002343853 SAMD1 0.011 sterile alpha motif domain containing 1 ATXN2 0.009 ataxin 2 AGXT 0.009 alanine-glyoxylate aminotransferase IRF7 0.008 interferon regulatory factor 7 isoform d IRF7 0.008 interferon regulatory factor 7 isoform a C2orf55 0.008 hypothetical protein LOC343990 BAT2D1 0.008 HBxAg transactivated protein 2 LOC100292745 0.007 PREDICTED: hypothetical protein LOC100290074 0.007 PREDICTED: hypothetical protein XP_002346855 LOC100287034 0.007 PREDICTED: hypothetical protein XP_002342693 ZNF503 0.007 zinc finger protein 503 CELSR1 0.007 cadherin EGF LAG seven-pass G-type receptor 1 CHST2 0.007 carbohydrate (N-acetylglucosamine-6-O) sulfotransfer... PRR14 0.007 proline rich 14 TAT 0.006 tyrosine aminotransferase RALGPS2 0.006 Ral GEF with PH domain and SH3 binding motif 2 [Homo... DACT3 0.006 thymus expressed gene 3-like TAF4 0.006 TBP-associated factor 4 BTBD2 0.006 BTB (POZ) domain containing 2 KLHDC7A 0.006 kelch domain containing 7A QRICH2 0.006 glutamine rich 2Human BLASTP results (used to prepare the table) | |||
Gene descriptions are from NCBI RefSeq. Search results were obtained with NCBI BLAST and RefSeq entries. When identical proteins are present, the self-match may not be listed first in BLASTP output. In such cases, the table above has been reordered to place it first.
See About the Figures for the scoring system used in the figure above right. The same scoring system was used in the table of BLASTP results.
Guide to the Human Genome
Copyright © 2010 by Stewart Scherer. All rights reserved.
