
| Name: SBF2 | Sequence: fasta or formatted (1849aa) | NCBI GI: 29788755 | |
|
Description: SET binding factor 2
|
Referenced in: Inositol Pathways
| ||
|
Composition:
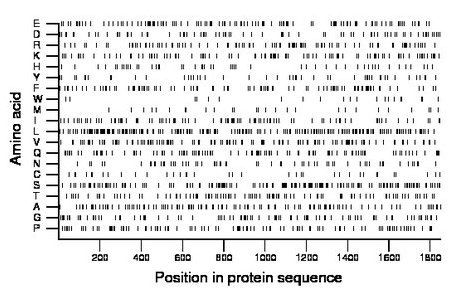
Amino acid Percentage Count Longest homopolymer A alanine 6.3 117 3 C cysteine 1.9 36 1 D aspartate 4.4 82 3 E glutamate 7.0 129 2 F phenylalanine 5.1 94 2 G glycine 5.1 94 2 H histidine 2.8 51 1 I isoleucine 4.9 91 2 K lysine 5.7 105 3 L leucine 10.9 202 3 M methionine 1.6 29 2 N asparagine 3.3 61 2 P proline 5.5 102 3 Q glutamine 5.6 104 2 R arginine 5.2 96 2 S serine 8.8 163 4 T threonine 5.3 98 2 V valine 6.7 123 3 W tryptophan 1.1 21 1 Y tyrosine 2.8 51 2 |
Comparative genomics:
Search single species RefSeq proteins at NCBI
Search summary 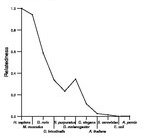
Figure data | ||
Related human proteins:Protein Relative score Description Self-match 1.000 SET binding factor 2 SBF1 0.577 SET binding factor 1 MTMR2 0.040 myotubularin-related protein 2 isoform 1 MTMR2 0.040 myotubularin-related protein 2 isoform 2 MTMR2 0.040 myotubularin-related protein 2 isoform 2 MTMR3 0.040 myotubularin-related protein 3 isoform b MTMR3 0.040 myotubularin-related protein 3 isoform a MTMR3 0.040 myotubularin-related protein 3 isoform c MTMR4 0.037 myotubularin related protein 4 DENND4B 0.035 DENN/MADD domain containing 4B MTM1 0.033 myotubularin MTMR1 0.032 myotubularin-related protein 1 DENND4A 0.030 DENN/MADD domain containing 4A isoform 1 DENND4A 0.030 DENN/MADD domain containing 4A isoform 2 MTMR7 0.029 myotubularin related protein 7 MTMR8 0.028 myotubularin related protein 8 MTMR9 0.026 myotubularin related protein 9 MTMR6 0.025 myotubularin related protein 6 DENND4C 0.023 DENN/MADD domain containing 4C MTMR10 0.023 myotubularin related protein 10 DENND5B 0.022 DENN/MADD domain containing 5B DENND5A 0.021 RAB6 interacting protein 1 MTMR12 0.020 myotubularin related protein 12 MTMR11 0.018 myotubularin related protein 11 isoform a MTMR11 0.018 myotubularin related protein 11 isoform b DENND3 0.016 DENN/MADD domain containing 3 DENND1B 0.015 DENN/MADD domain containing 1B isoform 1 DENND2C 0.015 DENN/MADD domain containing 2C DENND1B 0.015 DENN/MADD domain containing 1B isoform 2 DENND2A 0.014 DENN/MADD domain containing 2AHuman BLASTP results (used to prepare the table) | |||
Gene descriptions are from NCBI RefSeq. Search results were obtained with NCBI BLAST and RefSeq entries. When identical proteins are present, the self-match may not be listed first in BLASTP output. In such cases, the table above has been reordered to place it first.
See About the Figures for the scoring system used in the figure above right. The same scoring system was used in the table of BLASTP results.
Guide to the Human Genome
Copyright © 2010 by Stewart Scherer. All rights reserved.
