
| Name: RAB2B | Sequence: fasta or formatted (170aa) | NCBI GI: 254281345 | |
|
Description: RAB2B protein isoform 2
|
Referenced in:
| ||
Other entries for this name:
alt prot [216aa] RAB2B protein isoform 1 | |||
|
Composition:
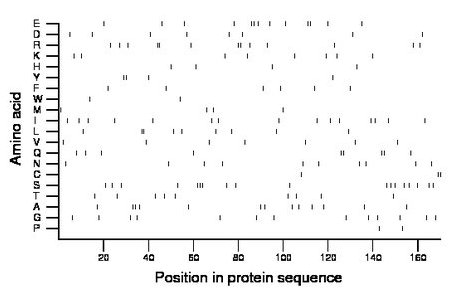
Amino acid Percentage Count Longest homopolymer A alanine 7.6 13 2 C cysteine 1.8 3 2 D aspartate 4.7 8 1 E glutamate 7.6 13 2 F phenylalanine 3.5 6 1 G glycine 7.6 13 1 H histidine 2.4 4 1 I isoleucine 8.8 15 1 K lysine 4.7 8 1 L leucine 5.3 9 2 M methionine 2.4 4 1 N asparagine 5.9 10 1 P proline 1.2 2 1 Q glutamine 5.3 9 2 R arginine 7.6 13 2 S serine 10.6 18 3 T threonine 5.3 9 1 V valine 4.1 7 1 W tryptophan 1.2 2 1 Y tyrosine 2.4 4 2 |
Comparative genomics:
Search single species RefSeq proteins at NCBI
Search summary 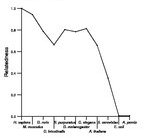
Figure data | ||
Related human proteins:Protein Relative score Description Self-match 1.000 RAB2B protein isoform 2 RAB2B 1.000 RAB2B protein isoform 1 RAB2A 0.787 RAB2A, member RAS oncogene family RAB14 0.505 GTPase Rab14 RAB4A 0.460 RAB4A, member RAS oncogene family RAB4B 0.448 ras-related GTP-binding protein 4b RAB8B 0.394 RAB8B, member RAS oncogene family RAB11B 0.387 RAB11B, member RAS oncogene family RAB11A 0.381 Ras-related protein Rab-11A RAB8A 0.378 mel transforming oncogene RAB37 0.368 RAB37, member RAS oncogene family isoform 2 RAB37 0.368 RAB37, member RAS oncogene family isoform 3 RAB13 0.365 RAB13, member RAS oncogene family RAB43 0.362 RAB43 protein RAB39 0.362 RAB39, member RAS oncogene family LOC100131294 0.356 PREDICTED: similar to RAB13, member RAS oncogene fa... LOC100131294 0.356 PREDICTED: similar to hCG24991 LOC100131294 0.356 PREDICTED: similar to hCG24991 RAB10 0.356 ras-related GTP-binding protein RAB10 RAB39B 0.349 RAB39B, member RAS oncogene family RAB1A 0.346 RAB1A, member RAS oncogene family isoform 1 RAB26 0.343 RAB26, member RAS oncogene family RAB18 0.340 RAB18, member RAS oncogene family RAB1B 0.340 RAB1B, member RAS oncogene family RAB19 0.333 RAB19, member RAS oncogene family RAB25 0.330 RAB25 RAB5B 0.327 RAB5B, member RAS oncogene family RAB5C 0.317 RAB5C, member RAS oncogene family isoform a RAB5C 0.317 RAB5C, member RAS oncogene family isoform b RAB12 0.317 RAB12, member RAS oncogene familyHuman BLASTP results (used to prepare the table) | |||
Gene descriptions are from NCBI RefSeq. Search results were obtained with NCBI BLAST and RefSeq entries. When identical proteins are present, the self-match may not be listed first in BLASTP output. In such cases, the table above has been reordered to place it first.
See About the Figures for the scoring system used in the figure above right. The same scoring system was used in the table of BLASTP results.
Guide to the Human Genome
Copyright © 2010 by Stewart Scherer. All rights reserved.
