
| Name: CREG2 | Sequence: fasta or formatted (290aa) | NCBI GI: 24475869 | |
|
Description: cellular repressor of E1A-stimulated genes 2
| Not currently referenced in the text | ||
|
Composition:
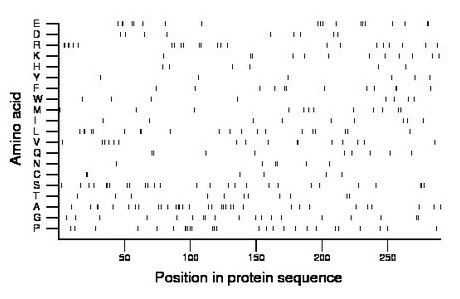
Amino acid Percentage Count Longest homopolymer A alanine 11.4 33 2 C cysteine 2.1 6 2 D aspartate 3.1 9 1 E glutamate 6.6 19 2 F phenylalanine 4.1 12 2 G glycine 6.6 19 2 H histidine 2.1 6 1 I isoleucine 3.1 9 1 K lysine 4.1 12 2 L leucine 6.9 20 2 M methionine 4.1 12 1 N asparagine 2.1 6 2 P proline 9.3 27 3 Q glutamine 3.1 9 2 R arginine 7.9 23 2 S serine 9.3 27 2 T threonine 3.8 11 1 V valine 5.5 16 2 W tryptophan 2.8 8 1 Y tyrosine 2.1 6 1 |
Comparative genomics:
Search single species RefSeq proteins at NCBI
Search summary 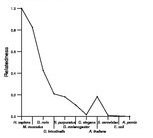
Figure data | ||
Related human proteins:Protein Relative score Description Self-match 1.000 cellular repressor of E1A-stimulated genes 2 CREG1 0.214 cellular repressor of E1A-stimulated genes C1QTNF8 0.016 C1q and tumor necrosis factor related protein 8 [Ho... LOC728503 0.016 PREDICTED: hypothetical protein LOC100291890 0.016 PREDICTED: hypothetical protein XP_002344521 LOC728503 0.016 PREDICTED: hypothetical protein LOC100289901 0.016 PREDICTED: hypothetical protein XP_002347167 LOC728503 0.016 PREDICTED: hypothetical protein LOC100288618 0.016 PREDICTED: hypothetical protein XP_002344285 MLXIP 0.014 MLX interacting protein LOC729370 0.014 PREDICTED: hypothetical protein CHADL 0.014 chondroadherin-like SPATC1 0.012 spermatogenesis and centriole associated 1 isoform ... SPATC1 0.012 spermatogenesis and centriole associated 1 isoform ... LOC646862 0.012 PREDICTED: hypothetical protein LOC646862 LOC646862 0.012 PREDICTED: hypothetical protein LOC646862 LOC646862 0.012 PREDICTED: hypothetical protein LOC646862 IGSF8 0.012 immunoglobulin superfamily, member 8 WBP11 0.012 WW domain binding protein 11 LOC100127891 0.012 PREDICTED: hypothetical protein TNRC18 0.012 trinucleotide repeat containing 18 CAMK2B 0.012 calcium/calmodulin-dependent protein kinase II beta ... LOC283999 0.010 hypothetical protein LOC283999 LOC100289065 0.010 PREDICTED: hypothetical protein LOC100289065 0.010 PREDICTED: hypothetical protein XP_002343789 TCF19 0.010 transcription factor 19 TCF19 0.010 transcription factor 19 MAP6D1 0.010 MAP6 domain containing 1 LOC100291781 0.010 PREDICTED: hypothetical protein XP_002344871 LOC100131225 0.010 PREDICTED: hypothetical proteinHuman BLASTP results (used to prepare the table) | |||
Gene descriptions are from NCBI RefSeq. Search results were obtained with NCBI BLAST and RefSeq entries. When identical proteins are present, the self-match may not be listed first in BLASTP output. In such cases, the table above has been reordered to place it first.
See About the Figures for the scoring system used in the figure above right. The same scoring system was used in the table of BLASTP results.
Guide to the Human Genome
Copyright © 2010 by Stewart Scherer. All rights reserved.
